Uses one-click integrations:
-
 Facebook Ads
If you don't use Facebook Ads, you can pull data from any of our 130+ one-click, native integrations or from spreadsheets, databases and other APIs.
Try this dashboard for freeWhat you’ll learn from this Facebook Ads Campaign Analysis Dashboard template
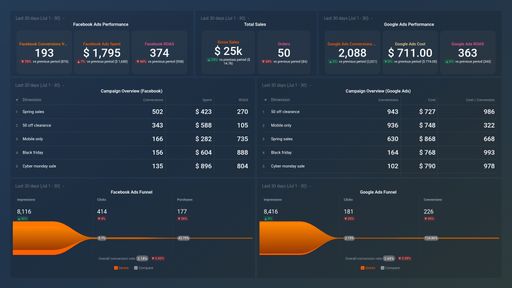
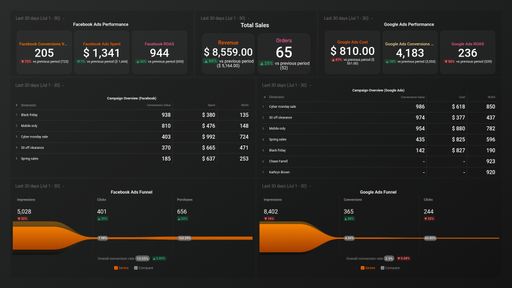
You can use this dashboard template to measure your Facebook ad campaign performance and track the most important metrics for all your active campaigns. Simply connect your Facebook Ads account, and you’ll learn:
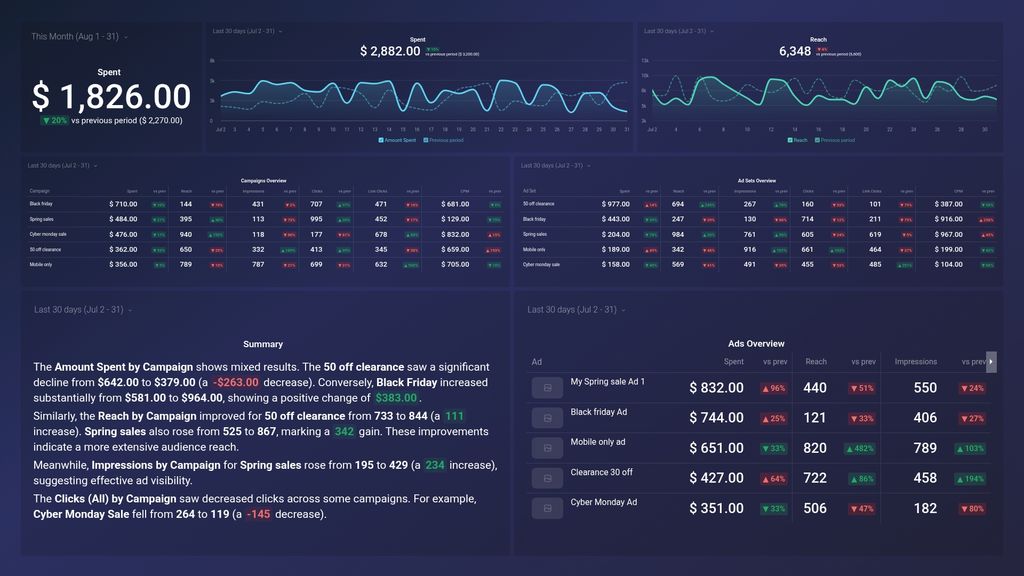
- Which campaign has the lowest cost per conversion? Find out how much you’re paying per 1,000 views for each Facebook ad campaign you’re running. Tracking your Facebook Ad CPM is crucial for assessing your brand reach and awareness, i.e., it tells you how well you’re doing when it comes to getting your ad in front of your target audience.
- How do I track impressions for my Facebook Ads campaign? View the number of times people saw your ad content within a specified period of time. Depending on your target audience and the type of campaign you’re running, paying attention to the number of impressions is highly beneficial.
- How many unique people saw my campaign? Find out how many people saw your Facebook ad campaign during a period of time. Get real-time data on your post, page, organic, viral, and paid reach metrics.
- What’s the total amount of money I’ve spent on my campaign? View the total amount of money you've spent so far running your ad campaign against your maximum budget at any given time.
- How do I track the number of clicks on my campaign? Track the number of clicks on your ad links within a specified period of time. This is a good indicator of your target audience’s interest in your ad content and can enable you to manage your CPA (cost-per-action) effectively.
Pull additional data using our extensive integration with Facebook Ads
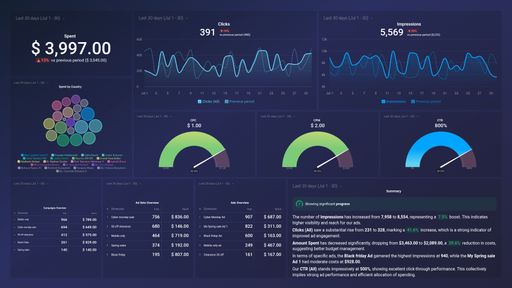
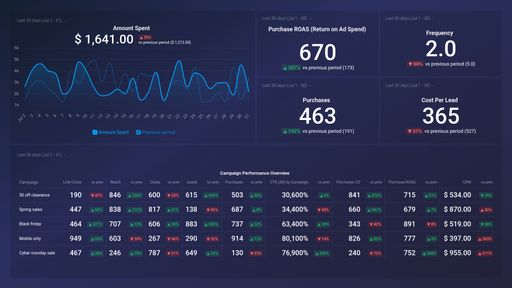
What other campaign metrics can you track and visualize with our integration with Facebook Ads? Almost anything:
-
- Individual campaign and ad performance
- Clicks, downloads, leads, and sale
- Cost per impression (CPM), click (CPC), and lead (CPL)
- Return on ad spend (ROAS)
- Ad spend and overall budget
- Progress towards your campaign goals, and more
In Databox, there are almost 100 Facebook Ads metrics already built and ready for you to visualize in a variety of different ways. With Query Builder and Data Calculations, the range of different metrics and metric combinations you can track from Facebook Ads widens.
Read more about Databox’s Facebook Ads integration.
Facebook Ads metrics included in this template
-
Clicks (All) by Ad
Clicks (All) by Ad metric in FbAds measures the total number of clicks received on an ad, including link clicks, button clicks, and clicks on any other part of the ad.
-
Clicks (All) by Ad Set
Clicks (All) by Ad Set metric measures the total number of clicks received by an ad set across all ads within the selected date range, including clicks on links, call-to-action buttons, and other interactive elements.
-
Clicks (All) by Campaign
Clicks (All) by Campaign is a metric that measures the total number of clicks received by all ads within a specific campaign, including all clicks on links, call-to-action buttons, and other interactions with the ad.
-
CPM by Ad
CPM (Cost per Mile) is a Facebook Ads metric that measures how much you pay for 1,000 ad impressions. It helps you determine the effectiveness of your ad campaign and the cost of it.
-
CPM by Ad Set
CPM (Cost Per Mille) by Ad Set is a metric that shows the average cost per 1,000 impressions for an ad set. It is used to determine the efficiency of your ad set and can help to optimize your campaign to increase impressions while lowering costs.
-
CPM by Campaign
CPM by Campaign is the cost per thousand impressions of an advertising campaign on Facebook. It measures how much the advertiser pays to have their ad shown 1,000 times to the target audience, and can be used to compare the effectiveness of different campaigns.
-
Impressions by Ad Set
Impressions by Ad Set metric tracks the number of times the ads in a particular ad set are displayed to Facebook users. This metric is used to measure the reach and frequency of ad campaigns.
-
Link Clicks by Ad
This metric measures the number of clicks on the ad link leading to the website or landing page. It doesn't measure any other clicks on the ad.
-
Link Clicks by Ad Set
Link Clicks by Ad Set shows the total number of clicks on links in your ad set, reflecting the effectiveness of your ad messages.
-
Link Clicks by Campaign
Link Clicks by Campaign is a metric that measures the number of clicks on links within an ad, broken down by each individual campaign. It helps track the effectiveness of campaigns in driving traffic to a desired website or landing page.
-
Reach by Ad
Reach by Ad is a Facebook Ads metric that represents the number of people who saw an ad at least once, regardless of whether or not they engaged with it.
-
Reach by Ad Set
The Reach by Ad Set metric provides the total number of people who saw your ad set, giving an estimate of the potential audience size for that particular ad.
-
Reach by Campaign
The Reach by Campaign metric measures the number of unique people who have seen an ad in a particular campaign during a set time period.
-
Amount Spent by Ad
Amount spent is a Facebook Ads metric that tracks the total amount of money spent on an ad campaign, ad set or ad during a specified time period. This includes the cost of impressions, clicks, and any other actions taken by users on the ad.
-
Amount Spent by Ad Set
The Amount Spent by Ad Set metric shows the total cost incurred on a specific ad set during a given time period. It includes all the charges relevant to the ad set, such as clicks, impressions, and conversions. This metric helps advertisers to track their expenses and make informed decisions about their ad campaigns.