Uses one-click integrations:
-
 HubSpot Marketing
If you don't use HubSpot Marketing, you can pull data from any of our 130+ one-click, native integrations or from spreadsheets, databases and other APIs.
Try this dashboard for freeWhat you’ll learn from this HubSpot Email Marketing Overview Dashboard Template
Connect your HubSpot Marketing account and learn:
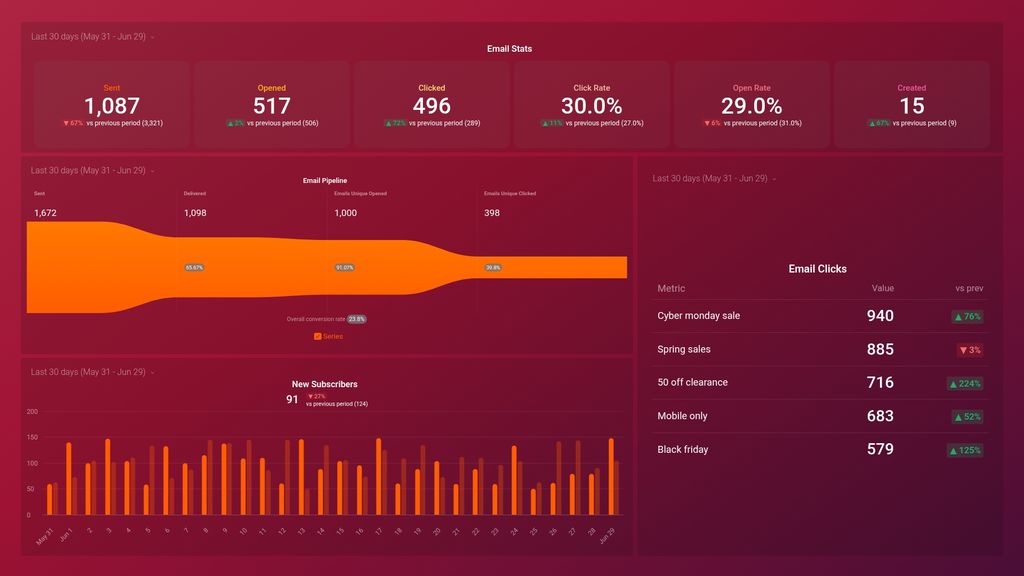
- What’s our overall email open rate? Track your overall email open rate with a daily line graph and spot any spikes or dips that can be associated with specific campaigns. Measure your current performance to month’s past and see if your email engagement is flat or growing.
- What’s our overall email click rate? Track your overall email click rate to see how many of your subscribers are actually clicking back to your website and/or offers. Use this information to measure against previous month’s performance and make adjustments when they matter most.
- How many new subscribers have we generated? See how many email subscribers you’ve generated during the last week and/or month. Visualize new subscribers with a line graph to spot the specific days where you generate more subscribers and learn what works best so you can double-down and optimize for more subscriptions.
- Which email campaigns have generated the most clicks? Identify the specific email campaigns that are generating the most clicks back to your website. Use this information to better understand which content resonates best with your audience and make adjustments across the board to improve email engagement.
- What does our email marketing pipeline look like? Get a quick overview of the overall emails sent, delivered, opened, and clicked over the last week and/or month. Use this funnel visualization to spot where subscribers drop off. Do you see a lot of opens but few clicks? Use this information to make the necessary improvements.
Pull additional data using our deep integration with HubSpot Marketing.
What else can you track and visualize with our deep integration with HubSpot Marketing? When it comes to traffic and conversions, almost anything:
- Website traffic and conversions
- Traffic and lead demographics
- Landing Page performance
- The conversion rate(s) throughout your marketing and sales funnel(s)
- Track and compare the efficiency of your marketing campaigns
- Monitor campaign improvements and growth over time
There are many, many different metrics and metric combinations you can track using HubSpot Marketing. And in Databox, you can quickly visualize 100s of HubSpot metrics in a variety of different ways, alongside all the important metrics from other data sources you’re using.
Read more about Databox’s HubSpot Marketing integration.
HubSpot Marketing metrics included in this template
-
Emails Unique Clicked by Email Title (by Last Updated)
The Emails Clicked by Email Title (by Last Updated) metric measures the number of clicks on each email title, sorted by the date the email was last updated, providing insights into the effectiveness of recently updated email campaigns.
-
Emails Delivered
Emails Delivered indicates the total number of emails that were successfully delivered to the recipient's inbox without any errors or bounces.
- Email Open Rate