Uses one-click integrations:
-
 Google Ads
If you don't use Google Ads, you can pull data from any of our 130+ one-click, native integrations or from spreadsheets, databases and other APIs.
Try this dashboard for freeWhat you’ll learn from this Google Ads Campaign Performance Dashboard template:
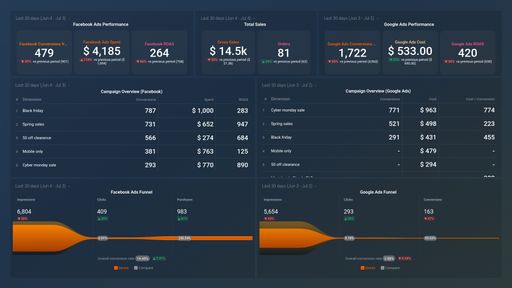
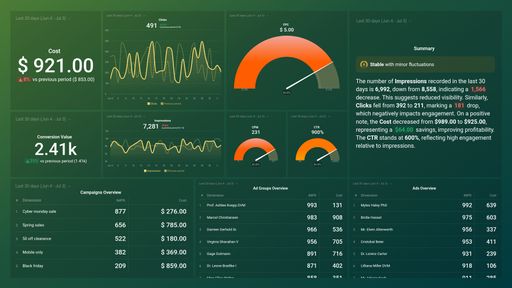
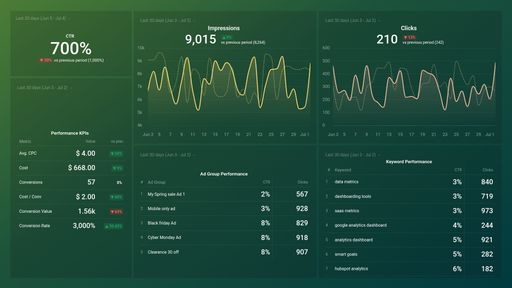
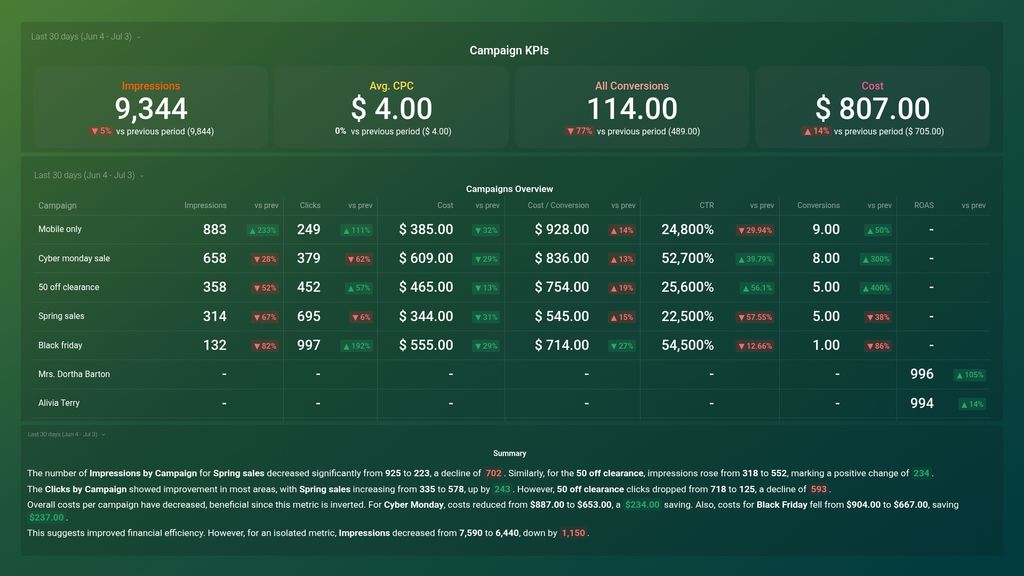
- How many times was my ad shown? View the number of times your ad was shown to your ideal audience on a search result page or another site on the Google Network within a specified time frame. Typically, your ad gets shown when there is a match between the campaign keywords you used and the terms used by your audience when conducting a search query.
- How many clicks did my ad get? View the number of clicks your ad receives daily. Watch out for sudden spikes or dips in the number of times your ad was clicked on, and find out why. Keeping track of this data is crucial as it is a good indicator of your ad’s relevance and targeting accuracy.
- How do I track the Click-Through Rate of my Google Ads campaigns? See what percentage of people clicked on your ad after it was shown to them.
- What is the Average Cost per Click on my ad? See the average amount you pay for each click on your ad at any given point in time. This metric is an important indicator. If the average Cost-per-click (average CPC) is too high, you’re paying too much, leading to a lower ROI.
- How much does it cost me to acquire a new customer? See how much it costs you to acquire a customer that carries out the desired action, i.e., a lead that eventually converts. Regardless of your industry, it is important to keep your cost per conversion low to maximize your PPC spend.
- What percentage of your ad interactions resulted in actual conversions? Track your conversion data in real-time. See what percentage of users that interacted with your ad carried out the desired action within a specified time period.
Pull additional data using our robust integration with Google Ads.
What else can you track and visualize with our deep integration with Google Ads? When it comes to analyzing your campaigns, pretty much anything:
- Impressions, clicks, and conversions
- Cost analysis
- Keyword analysis
- Conversion analysis
- Engagement by Ad, Ad Group, and Ad Campaign, and more.
There are numerous metrics and metric combinations you can track using Google Ads. And in Databox, you can quickly visualize dozens of Google Ads metrics in various ways.
Read more about Databox’s Google Ads integration.
Google Ads metrics included in this template
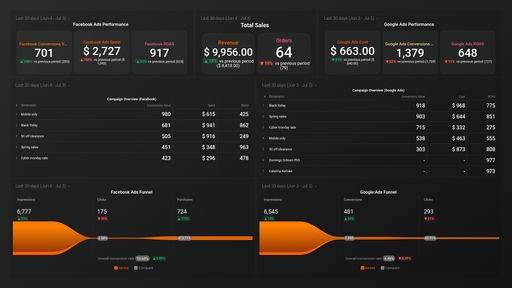
- ROAS by Campaign
-
All Conversions
The All Conversions metric is a measure of all desired actions taken by users on your website after clicking an ad, including purchases, form submissions, and phone calls.
-
Clicks by Campaign
Clicks by Campaign is a metric within Google AdWords that shows the total number of clicks your ads received for each individual campaign. It helps you measure the effectiveness of your campaigns and make informed decisions about future ad spending.
-
Conversions by Campaign
Conversions by Campaign is a metric that tracks the number of conversions (such as leads or sales) that have been generated by each individual campaign in your Google Ads account. This metric can help you identify which campaigns are driving the most valuable results for your business.
-
Cost / Conversion by Campaign
Cost/Conversion by Campaign is a metric that compares the total cost of a specific AdWords campaign with the number of conversions generated by that campaign. It helps to determine the efficiency and profitability of each campaign and guides decisions on budget allocation and optimization.
-
Cost by Campaign
Cost by Campaign metric shows the amount of money spent on a specific campaign in your Google Ads account. This metric helps you understand how much you are spending on each campaign and adjust your budget accordingly for optimum results.