Uses one-click integrations:
-
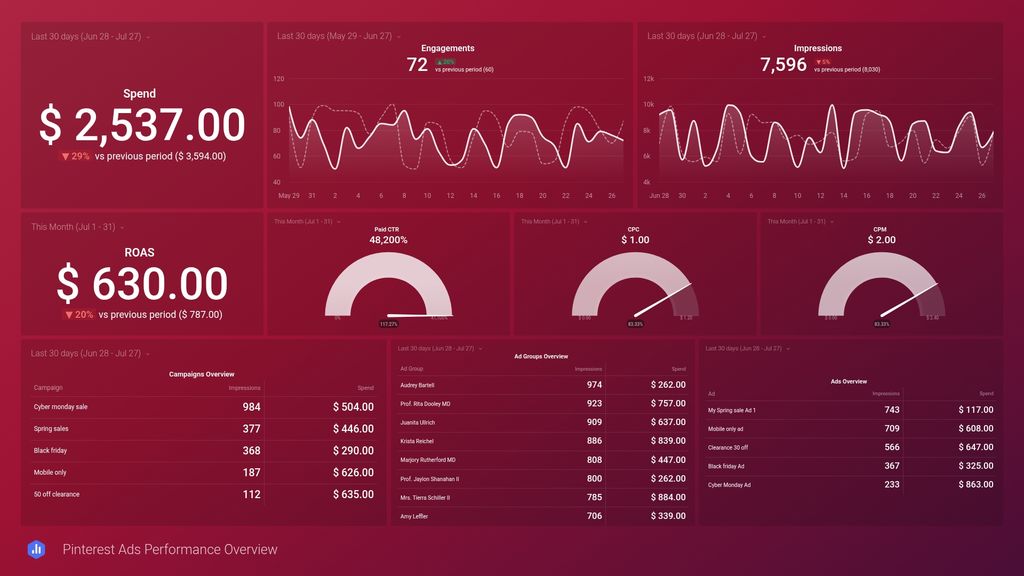
 Pinterest Ads
If you don't use Pinterest Ads, you can pull data from any of our 130+ one-click, native integrations or from spreadsheets, databases and other APIs.
Try this dashboard for free
Pinterest Ads metrics included in this template
-
CPC
Cost Per Click (CPC) is the amount an advertiser pays each time a user clicks on their ad. It is a key metric used to measure the effectiveness and cost-efficiency of Pinterest advertising campaigns.
-
CPM
CPM (Cost Per Mille) is the cost paid by advertisers for a thousand impressions of their ad on Pinterest. It is a common metric used to measure ad performance and cost efficiency.
-
Engagements
Engagements metric on Pinterest Ads measures actions users take with your ad, like clicks, saves, comments, and close-ups. It shows how engaged your audience is with your content.
-
Impressions
Impressions metric on Pinterest Ads measures the total number of times your ad is shown to users. It indicates the reach and visibility of your ad campaign among the target audience.
-
Impressions by Ad
Impressions by Ad is a metric that measures the number of times your ad has been displayed on Pinterest to users, showing how many opportunities there are for your ad to be seen.
-
Impressions by Ad Group
Impressions by Ad Group measures the total number of times ads from a specific ad group were displayed to users on Pinterest. It helps evaluate the reach and visibility of each ad group.
-
Impressions by Campaign
Impressions by Campaign metric measures the total number of times an ad from a specific campaign has been viewed by users on Pinterest, indicating the reach and visibility of the campaign.
-
Paid CTR
Paid CTR (Click-Through Rate) is a performance metric that measures the percentage of people who clicked on your ad after seeing it. It indicates the effectiveness of your ad in driving user engagement and interest.
-
ROAS
ROAS (Return on Ad Spend) is a metric that measures the revenue generated for every dollar spent on advertising. It helps evaluate the effectiveness and efficiency of advertising campaigns.
-
Spend
The Spend metric in Pinterest Ads refers to the amount of money you have spent on your ad campaigns to reach your target audience and promote your products or services on the platform.
-
Spend by Ad
The Spend by Ad metric measures the total amount spent on each individual ad campaign on Pinterest, providing insights into budget allocation and performance analysis.
-
Spend by Ad Group
Spend by Ad Group represents the total amount of money spent on advertising within specific ad groups on Pinterest, helping track campaign performance and optimize strategies.
-
Spend by Campaign
Spend by Campaign is the total amount of money spent on advertising within a specific campaign on Pinterest over a set period of time.