Uses one-click integrations:
-
 Google AdSense
If you don't use Google AdSense, you can pull data from any of our 130+ one-click, native integrations or from spreadsheets, databases and other APIs.
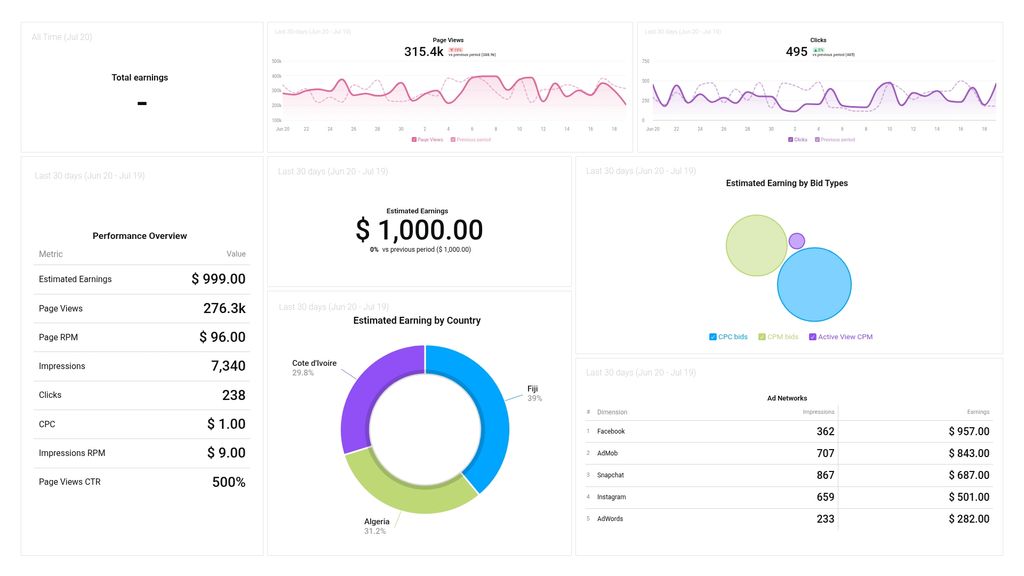
Try this dashboard for freeWhat you’ll learn from this Google AdSense Account Overview Dashboard Template:
By connecting your Google AdSense account, get answers to the following:
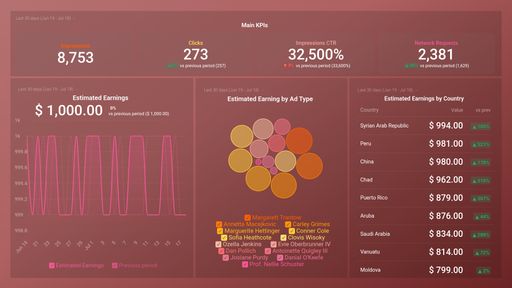
- How can I track my earnings from AdSense? Instantly track your revenue from running ads on your site, as well as the average earnings per one thousand impressions for your chosen time period. Compare your earnings for the current time period to the same time last week, month, quarter, or year.Discover trends such as a steady decline or increase in earnings and impressions RPM, or a sharp dip or spike--dig in to learn why this happened.
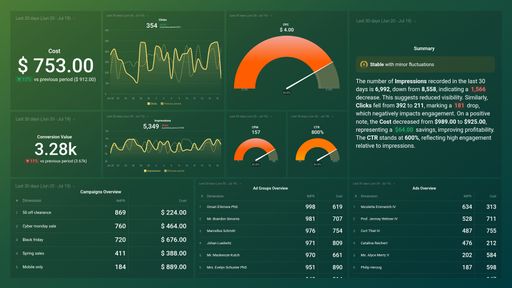
- How do I measure the performance of my AdSense campaigns? Get complete visibility of the performance of your AdSense campaign anytime, anywhere. Track valuable metrics such as Estimated Earnings, Page RPM, Page Impressions, Clicks, CPC, Impressions RPM, and Page Views CTR.
- How much revenue do I generate from monetizing my website? View the total dollar amount earned from monetizing your website content through targeted ads. Also, see the estimated earnings you’d accrue from running ads on your website during a given time period.
- How do I check my estimated earnings for my chosen bid type? See how much you can earn from running ads within a given time period based on your chosen bidding strategy, that is, CPC (Cost per Click), CPM (Cost-per-thousand impressions), vCPM (Active View cost-per-thousand-impressions), and CPE (Cost-per-engagement).
- What country generates the most ad revenue for my business? Estimate the earning potential of ads on your website for each country AdSense covers. Use this data to optimize your ad monetization strategy for those countries that are more likely to drive more ad revenue for your business
Pull additional data using our robust integration with Google AdSense.
What else can you track and visualize with our robust integration with AdSense? When it comes to analyzing your campaigns, pretty much anything:
- Impressions and clicks
- Pageviews
- Earnings overview
- Page click-through rate
- Engagement by Ad, Ad Group, Ad Campaign, and more
There are numerous metrics and metric combinations you can track using AdSense. And in Databox, you can quickly visualize dozens of AdSense metrics in various ways.
Read more about Databox’s Google AdSense integration.
Explore more Google AdSense dashboards.
Google AdSense metrics included in this template
-
Clicks
Clicks is a metric in Google AdSense that measures the number of times a user clicks on an ad displayed on a website or app. It is an important metric for publishers as it directly impacts their revenue.
-
CPC (Cost per Click)
CPC, or cost per click, is the amount of money an advertiser pays for each click on their ad. It is a popular metric in online advertising, reflecting the effectiveness and profitability of ad campaigns.
-
Estimated Earnings
The Estimated earnings metric is an approximate amount of revenue that a publisher is expected to earn from AdSense ads displayed on their website or app. It takes into account various factors such as the number of ad impressions, clicks, and ad types.
-
Estimated Earnings by Bid Type
The Estimated earnings by Bid Type metric shows how much revenue is earned by each bidding method used in your AdSense account, such as cost per click (CPC) or cost per thousand impressions (CPM).
-
Estimated Earnings by Country
The Estimated earnings by Country metric in Google AdSense shows the amount of revenue earned from ads displayed to users located in various countries. It helps publishers understand which countries are generating the highest revenue and adjust their strategy accordingly.
-
Estimated Earnings by Network
The Estimated earnings by Network metric shows the total estimated revenue earned by a publisher through the AdSense program across all network types, including AdSense for Content, AdSense for Search, and AdSense for Games.
-
Impressions
Impressions refer to the number of times an ad is displayed on a website or app. It is a metric used to measure the reach and visibility of an ad campaign.
-
Impressions RPM
Impressions RPM (revenue per thousand impressions) is a metric that indicates the estimated amount of earnings for every 1000 ad impressions served on a webpage. This is calculated by dividing estimated earnings by the number of ad impressions and multiplying the result by 1000.
-
Impressions by Network
Impressions by Network is a metric in Google AdSense that shows the number of times ads were displayed to users on a specific network, such as the Display Network or AdSense for Search. It is a measure of ad exposure and can help publishers understand which networks are generating the most ad views.
-
Page Views CTR
Page Views CTR (Click-Through Rate) is the ratio of the number of clicks on your ads to the number of page views on your website, calculated as a percentage. It indicates the effectiveness of your ad placements and design in generating clicks from your audience.
-
Page Views RPM
Page Views RPM is a Google AdSense metric that represents the revenue earned per 1000 pageviews on a website. It is calculated by dividing the total earnings by the number of pageviews, multiplied by 1000.
-
Page Views
Page Views refer to the number of times a webpage on a website has been viewed by a user on their screen, regardless of how many times they refresh the page.
-
Total Earnings
The Total Earnings metric in Google AdSense refers to the accumulated amount of revenue earned by a publisher from ad clicks, impressions, and other activities within a specific time frame.