Uses one-click integrations:
-
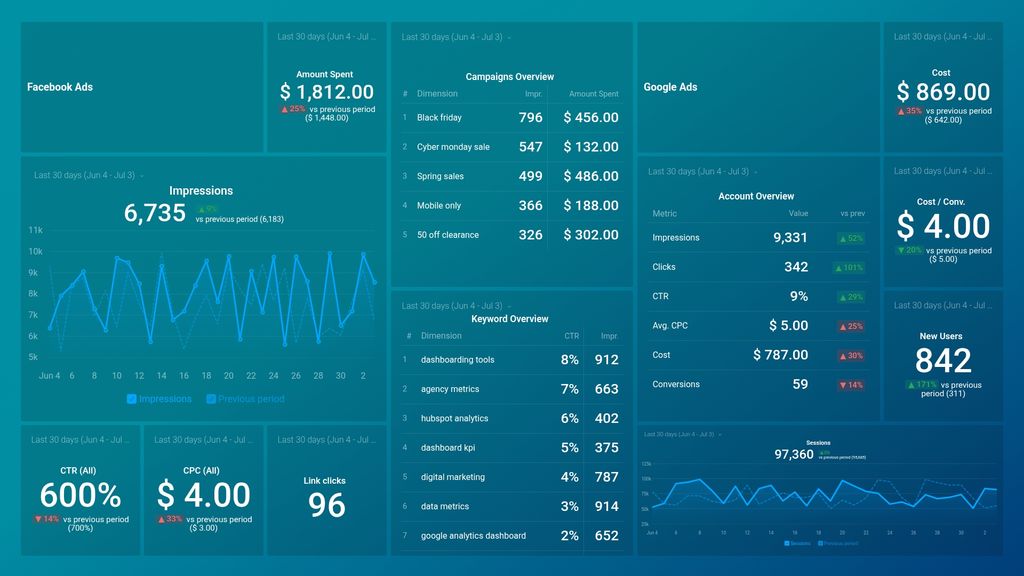
 Google Analytics 4
-
 Facebook Ads
-
 Google Ads
If you don't use Google Analytics 4, Facebook Ads or Google Ads, you can pull data from any of our 130+ one-click, native integrations or from spreadsheets, databases and other APIs.
Try this dashboard for freeWhat you’ll learn from this Facebook Ads, Google Ads & GA4 Dashboard Template
Simply connect your Facebook Ads, Google Ads and GA4 accounts, and you’ll learn:
- Which metrics should I be tracking for my Google Ads campaigns? Measure the effectiveness of your Google ads campaign by tracking key metrics such as how many people saw your ad, and clicked on it, as well as your click-through rate (CTR), average cost per click (CPC), conversions, and so on. By tracking these metrics, you’ll be able to measure your actual results against your goals and ROI to determine what to prioritize, change, or optimize regarding your ad strategy.
- How do I measure the click-through rate for all my ad groups? See the percentage of impressions that resulted in clicks for each ad group that makes up your existing campaigns. Find out how many people actually clicked on your ad; this is a good indicator of your ad’s relevance.
- How do I track keyword-level clicks on my ads? Track the performance of specific keywords for your Google Ads campaigns. View the number of clicks that resulted from these keywords in a month as well as CTR. A high CTR indicates to Google that you’re useful to people searching online using those specific keywords.
What else can you track and visualize with our deep integration with Facebook Ads, Google Ads and GA4?
When it comes to attributing your to traffic and conversions, almost anything:
- Impressions, clicks, and conversions
- Cost analysis
- Keyword analysis
- Conversion analysis
- Paid advertising
- Landing page performance
- Engagement by Ad, Ad Group, and Ad Campaign
- Website Engagement, and more
There are numerous metrics and metric combinations you can track using Facebook Ads, Google Ads and GA4. And in Databox, you can quickly visualize dozens of Facebook Ads, Google Ads and GA4 metrics in a variety of ways.
Read more about Databox’s Facebook Ads, Google Ads and GA4 integrations.
Facebook Ads metrics included in this template
-
CPC (All)
CPC (All) is the average cost per click across all ad types, placements, and objectives in a Facebook Ads campaign. It shows how much an advertiser pays for each click on their ad.
-
CTR (All)
CTR (All) is a Facebook Ads metric that measures the ratio of clicks to impressions for all ad placements. It helps to evaluate the ad's relevance to users and overall performance. A higher CTR indicates better user engagement and ad performance.
-
Impressions by Campaign
Impressions by Campaign is a metric that measures how many times an ad was shown on Facebook or Instagram to its target audience. It shows the total number of times an ad was displayed, regardless of whether someone clicked on it or not. This metric is useful in evaluating the reach of a specific campaign and can help in optimizing the ad's targeting and creative elements to increase engagement.
-
Link Clicks
Link Clicks is a metric that shows the number of clicks your ad received that led people to a destination on or off Facebook, such as your website.
Google Ads metrics included in this template
-
Conversions
The Conversions metric measures the number of desired actions taken by users on your website after clicking on your ad, such as completing a purchase or filling out a form.
-
Cost
Cost is the amount of money you have spent on your Google AdWords campaign. It can be viewed as a total cost or broken down by ad, keyword, or other customizable factors.
-
Cost / Conversion
Cost/Conversion is a Google AdWords metric that measures the amount of money spent on a campaign divided by the number of conversions (desired actions taken by users). This metric helps advertisers determine the efficiency of their campaigns and optimize them accordingly to achieve their conversion goals at a lower cost.
-
CTR by Keyword Id by Campaign by Keyword
CTR by Keyword Id by Campaign by Keyword is a metric that measures the click-through rate of specific keywords within a particular AdWords campaign. It helps to identify which keywords are driving the most clicks and optimize bidding strategies accordingly.