Uses one-click integrations:
-
 Google Analytics 4
-
 HubSpot Marketing
If you don't use Google Analytics 4 or HubSpot Marketing, you can pull data from any of our 130+ one-click, native integrations or from spreadsheets, databases and other APIs.
Try this dashboard for free
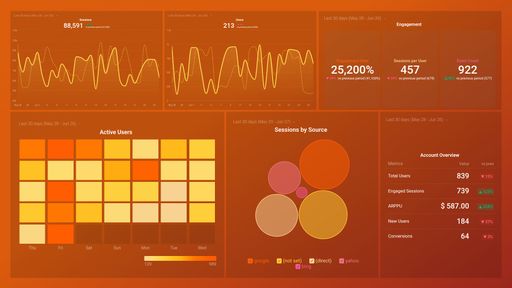
Google Analytics 4 metrics included in this template
-
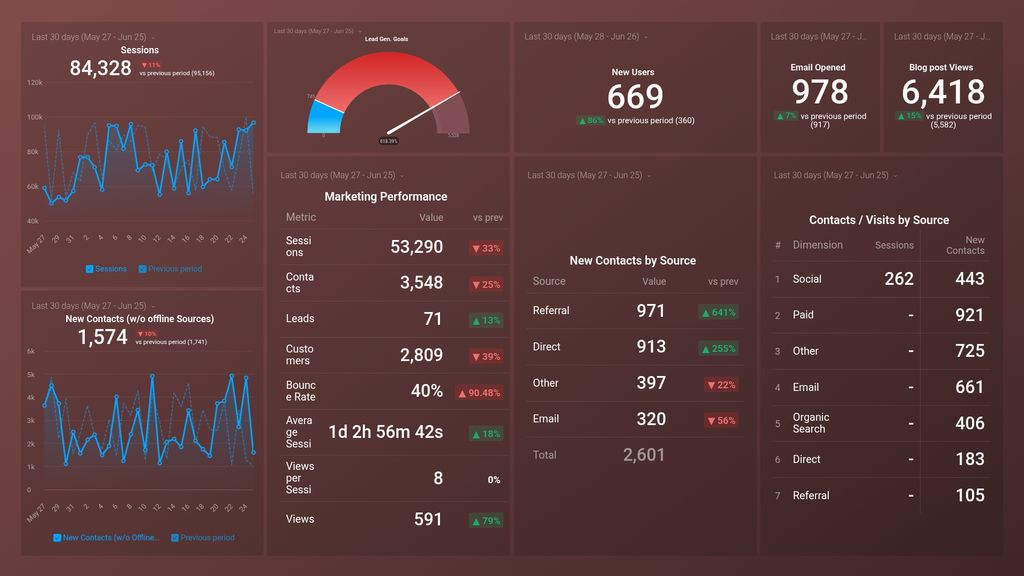
New Users
New Users metric represents the number of unique, first-time users to a website or app during a specific time period. It helps measure the growth of a business's audience and identify opportunities for acquisition and retention strategies.
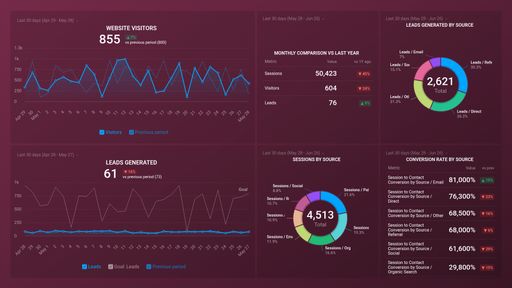
HubSpot Marketing metrics included in this template
- New Contacts (w/o Offline Source) Goal (Goal)
-
New Contacts (w/o Offline Source)
The New Contacts (w/o Offline Source) metric in Hubspot measures the number of new contacts acquired through online sources, such as website visits, social media, or email marketing campaigns, excluding any offline sources such as trade shows or direct mail.
-
New Contacts by Source
The New Contacts by Source metric shows the number of new contacts acquired from various sources within a defined period of time, helping businesses identify their most effective lead generation channels.
-
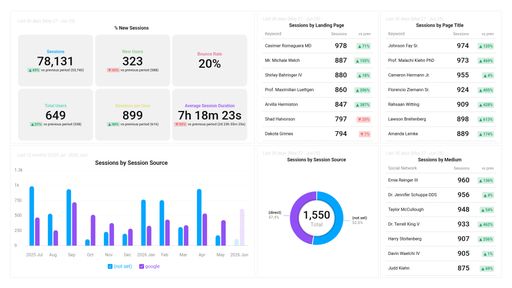
New Customers (w/o Offline Source)
New Customers (w/o Offline Source) is a Hubspot metric that shows the number of new customers gained through online channels, excluding any offline sources. It helps track the effectiveness of online marketing efforts and identify areas for improvement.
-
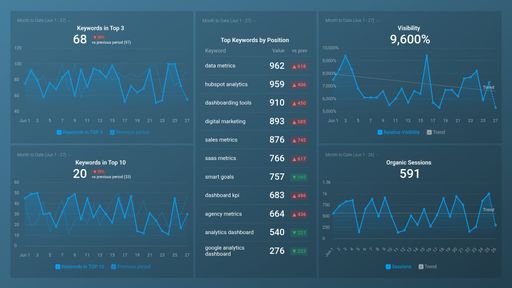
Emails Unique Opened
Emails Opened is a metric that reveals the percentage of recipients who opened your email. It's an essential measurement as it helps determine the success rate of your email marketing campaigns. It also enables you to identify the effectiveness of your email subject line and content.