Uses one-click integrations:
-
 HubSpot Marketing
If you don't use HubSpot Marketing, you can pull data from any of our 130+ one-click, native integrations or from spreadsheets, databases and other APIs.
Try this dashboard for freeWhat you’ll learn from this HubSpot Lead Generation Dashboard Template:
Connect your HubSpot Marketing account and learn:
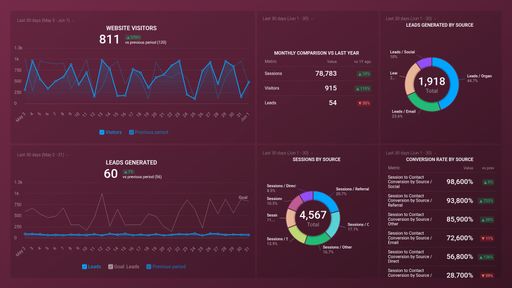
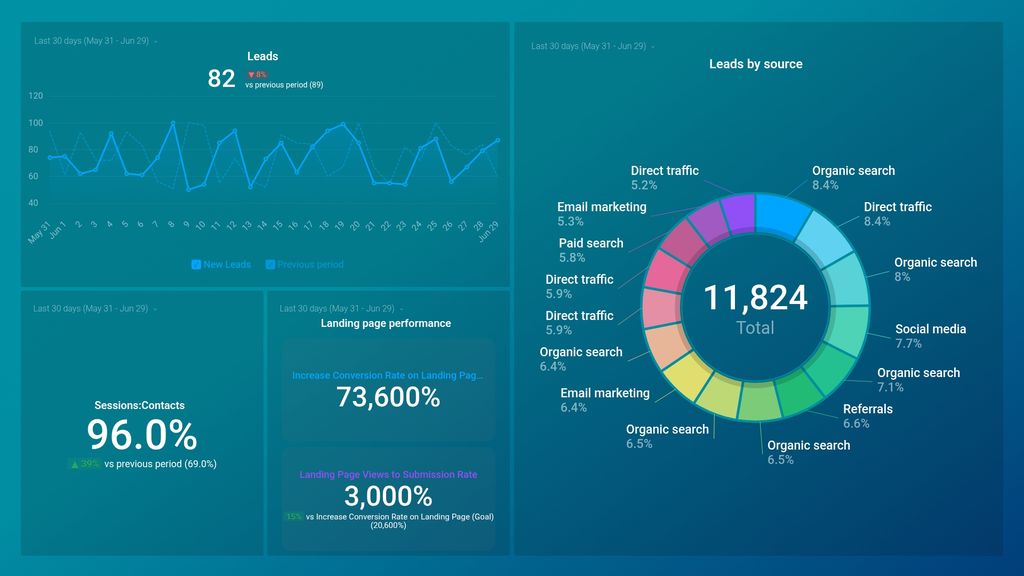
- How do I track where my leads come from? Find out which channels your leads originate from. See what percentage of the total leads in your funnel can be attributed to specific lead sources. By tracking this data, you’ll better understand how to tailor your marketing and sales efforts to drive more quality leads and on which channels to focus.
- How many leads did I generate last week? Keep track of the number of leads you (& your team) generate daily. Then, see how many more leads you need to generate to hit your target for the day/week/month/quarter.
- How do I analyze my landing page performance? Track the conversion rate of your landing pages in real-time. Landing page conversion rates are pivotal to the success of your lead generation strategy. Whenever you see a decline in the number of visitors that turn into leads, it is an indicator that your highly visited landing pages need to be optimized to drive more signups and, ultimately, sales.
- How do I measure my contact conversion rate? See what percentage of your website traffic actually converts into new contacts for the selected time period.
Pull additional data using our deep integration with HubSpot Marketing.
What else can you track and visualize with our deep integration with HubSpot Marketing? When it comes to traffic and conversions, almost anything:
- Website traffic and conversions
- Traffic and lead demographics
- The conversion rate(s) throughout your marketing and sales funnel(s)
- Social media engagement
- Track and compare the efficiency of your marketing campaigns
- Landing page performance
- Profile visits
There are many, many different metrics and metric combinations you can track using HubSpot Marketing. And in Databox, you can quickly visualize 100s of HubSpot metrics in a variety of different ways, alongside all the important metrics from other data sources you’re using.
Read more about Databox’s HubSpot Marketing integration.
HubSpot Marketing metrics included in this template
- Increase Conversion Rate on Landing Page (Goal)
- Visits to Contacts (%)
-
Landing Page Views to Submission Rate
The Landing Page Views to Submission Rate metric measures the percentage of people who submit a form on a landing page after viewing it. It helps to evaluate the effectiveness of the landing page in converting visitors into potential leads.