![The 10 Most-Tracked HubSpot Marketing Metrics [Original Data]](https://cdnwebsite.databox.com/wp-content/uploads/2018/02/26115448/HubSpotMetricsBG.png "The 10 Most-Tracked HubSpot Marketing Metrics [Original Data]")
Table of contents
This data was sourced from just over 49,000 Datablocks used to track HubSpot Marketing metrics in Databox. (What is a Datablock?)
Despite continuous proclamations of its impending death, email is still the top digital marketing channel in terms of both profit and popularity.
According to the Data & Marketing Association’s (DMA) annual benchmark report, email was the top profit generator in 2017 with a cost-per-acquisition (CPA) of only $10.32.
Social media, website chat, the explosion of audio and video–email has, and continues to, outperform these channels.
This is why HubSpot, and other automation software products, have seen sky-high adoption rates and market valuations for the better part of the past decade. They’ve taken the power and effectiveness provided by your standard email service provider (ESP) and integrated with all of the channels that drive acquisition–blogging, social media, paid media, landing pages, etc.

While our recent analysis of Google Analytics showed that the majority of marketers leverage the tool for tracking channel attribution and website behavior, our analysis of over 49k metrics tracked in HubSpot uncovers a focus around email marketing, and more specifically:
- Acquisition: How many new leads did we generate? Which channels are driving new contacts?
- Qualification: How many of my leads are qualified for marketing and/or sales?
- Segmentation: How are my different segments of qualified leads growing?
- Marketing and sales: How many people are clicking our emails? How many new customers did we generate?
While you’ll notice the obligatory metrics like “Sessions” and “Sessions by Source,” the most-tracked HubSpot metrics are largely focused on building and executing an effective email marketing strategy.
To get a handle on how marketers prefer to visualize these metrics, I talked to some prolific users of both HubSpot and Databox.
*All the data included in the screenshots below is sample data and not reflective of any user and/or client data.
First, What’s a Datablock?
A Datablock is one block of data that, along with any number of other Datablocks, make up a single dashboard.
They’re customizable, resizable, and many of them are pre-configured so that all users need to do is drag and drop them to their dashboard to quickly visualize data.
All dashboards are made up of Datablocks. See for yourself in the quick video I recorded below…
Visits
*Note: This data was collected prior to HubSpot switching from “Visits” to “Sessions.”
Prior to the change, HubSpot defined a “visit” as the action triggered when someone landed on your website from “a page outside of your website.”
Now, HubSpot tracks “sessions”, which is defined very similar to how Google Analytics does. Here is HubSpot’s definition of its new metric, “Sessions.”
“A series of analytics activities taken by a visitor to your website. Activities can include page views, CTA clicks, events, etc. A session expires after 30 minutes of inactivity.”
Recommended Datablock: Line graph with comparisons turned on. – Sean Henri, Pepperland Marketing.
“Being able to spot the ups and downs in our traffic helps us detect and correct emerging problems early, while the trendline helps ensure that we’re moving in the right direction,” said Henri.

PRO TIP: How Well Are Your Marketing KPIs Performing?
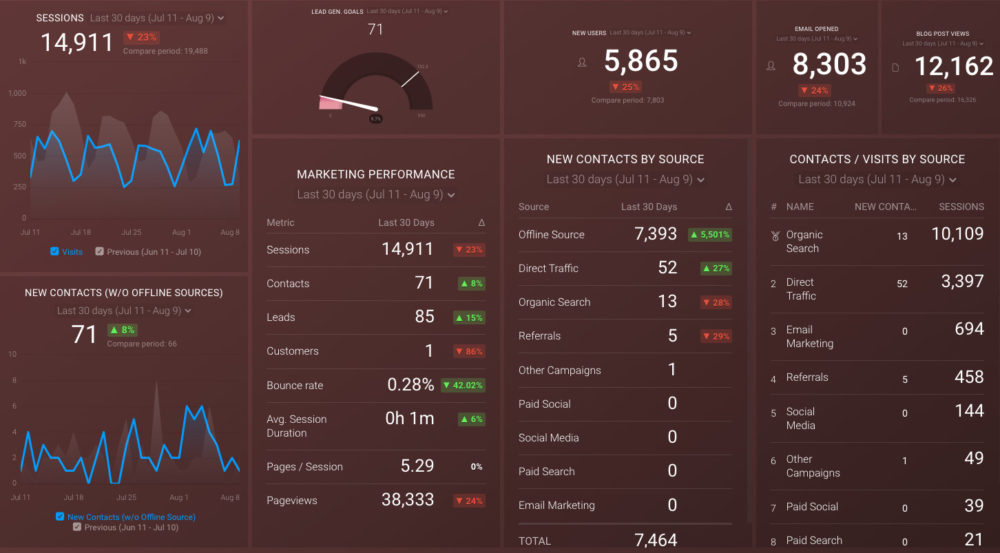
Like most marketers and marketing managers, you want to know how your efforts are translating into results each month. How is your website performing? How well are you converting traffic into leads and customers? Which marketing channels are performing best? How does organic search compare to paid campaigns and to previous months? You might have to scramble to put all of this together in a single report, but now you can have it all at your fingertips in a single Databox dashboard.
Our Monthly Marketing Performance Dashboard includes data from Google Analytics 4 and HubSpot Marketing with key performance metrics like:
- Website sessions, new users, and new leads. Basic engagement data from your website. How much traffic? How many new visitors? How many lead conversions?
- Lead generation vs goal. Did you reach your goal for lead conversion for the month, quarter, or year? If not, by how much did you miss?
- Overall marketing performance. A summary list of the main KPIs for your website: sessions, contacts, leads, customers, bounce rate, avg. session duration, pages/session, and pageviews.
- Email response. Overall, how effective were your email campaigns, measured by email opens?
- Blog post traffic. How much traffic did your blog attract during a certain period?
- New contacts by source. Which sources drove the highest number of new contacts
- Visits and contacts by source. How did your sources compare by both sessions and new contacts in a certain period of time?
Now you can benefit from the experience of our Google Analytics and HubSpot Marketing experts, who have put together a plug-and-play Databox template that contains all the essential metrics for monitoring and analyzing your website traffic and its sources, lead generation, and more. It’s simple to implement and start using as a standalone dashboard or in marketing reports!
You can easily set it up in just a few clicks – no coding required.
To set up the dashboard, follow these 3 simple steps:
Step 1: Get the template
Step 2: Connect your HubSpot and Google Analytics 4 accounts with Databox.
Step 3: Watch your dashboard populate in seconds.
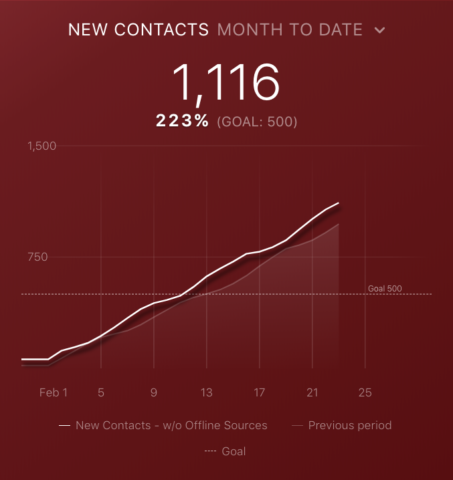
New Contacts (w/o offline sources)
This metric calculates the number of new contacts, or email addresses, generated during a specific time frame.
According to our study, most users opt to exclude offline sources from their reporting, which stays consistent further down the funnel for “New Customers” as well.
Recommended Datablock: Line chart, cumulative, with comparisons and goals turned on. – Sean Henri, Pepperland Marketing.
“We have a flatscreen in our office that rotates through all of our Databoards,” said Henri. “We use this visualization to monitor our progress towards monthly, quarterly, and annual goals on a day-to-day basis so that we can decisions that will help us meet our objectives.”
Rob Ellis, Lollipop Local
“The line graph makes it easy to see increase or decreases. If we notice something we weren’t expecting, then we investigate further by looking into HubSpot reports.”
Visits by Source
HubSpot breaks down website traffic into the various sources that drive people to your site, i.e. organic search, email, social media, direct, etc.
It’s worth noting that HubSpot’s verbiage of “sources” differs slightly from Google Analytics’ “Sessions by Channel”, however, both metrics are comparable.
Recommended Datablock: Pie chart. – Jonathan Stanis, Weidert Group.
“It shows how well spread out, or not, our traffic sources are,” said Stanis. “This lets us know a website’s strengths and weaknesses when it comes to traffic and helps direct where we want to put our efforts. For example, on Weidert.com we have a high amount of organic search traffic, but we could be doing better on social media.”

New MQLs
HubSpot allows users to organize their leads according to the stage of the buying cycle they’re in. As a result, the criteria for this metric will vary greatly depending on the user and/or organization using HubSpot.
Marketing qualified leads (MQLs) often refer to leads that are qualified according to a set of criteria specified by the user. Due to their level of qualification, these leads are typically nurtured with more marketing material in order to work them further down the sales funnel.
Recommended Datablock: Progress Bar with goals turned on. – Chris Handy, ClosedWon.

New Contacts by Source
New contacts by source track the specific sources (organic search, email, social media, direct, etc.) generating new contacts during a specific time period.
Recommended Datablock(s): Leaderboard for leads and visits by source, Table for contacts by source. – Chris Handy, ClosedWon.
“I like to have these two side by side so that we can lead vs traffic flow from each channel,” said Handy. “The next one is so that we can look at period improvements.”

New Customers
New customers track the number of customers whose first conversion occurred during a specific time frame.
Recommended Datablock: Funnel – Chris Handy, ClosedWon.
“When looking at how customers move through the customer lifecycle, we use Datablocks to create a pipeline view to see how things are moving through the funnel,” said Handy. “It is important when considering later stages like MQL, SQL to include ‘all’ rather than ‘new’ because people will come in and move through [the funnel] at their own pace.”

New SQLs
Like MQLs, Sales Qualified Leads (SQLs) are organized based on specific user criteria and usually denote leads that are ready to be engaged by sales.
Recommended Datablock: Number with comparisons turned on. – Sandy Moore, Smartbug Media.
“Being able to use Databox to track new SQLs is very valuable for sales and marketing alignment,” said Moore. “By outlining the number of new SQLs within the sales reporting software, we’re able to be transparent on the number of sales qualified leads marketing is producing for the sales team to work into opportunities.”

New Leads
While “Contacts” denote any new email address added to the database, “New Leads” is a measure of where these contacts fall in the lead lifecycle stage.
Recommended Datablock: Gauge with goals turned on. – Chris Handy, ClosedWon.
“When looking at a single metric, there is usually a person or an initiative that hinges on that metric improving,” said Handy. “Choosing a Datablock like “Progress Bar” or “Gauge” and attaching the goal to it can allow you to see that number against a goal and previous period.”

Contacts by Smart List
HubSpot users can organize their leads according to any contact or company property they’re tracking in HubSpot. This can be anything from a contact’s geolocation, to the number of times they’ve visited specific pages, the specific emails they opened and/or clicked, etc.
Users pull together “smart lists” based on the properties they’ve chosen to isolate.
“Contacts by Smart List” is simply the total number of contacts in one specific smart list.
Recommended Datablock: Progress Bar – Chris Handy, ClosedWon.
“We create interest tags that can be automatically applied to a contact in HubSpot when a prospect visits a certain feature page ‘X’ number of times,” said Handy. “This progress bar is a smart list based on who has that interest tag. Note that when you add a goal, it really does its job.
The last thing you will want to do is rename the Datablock to something anyone in your company will understand. This is the most important part.”

Emails Clicked
The number of times email, sent through HubSpot, were clicked during a specific time period.
Recommended Datablock: Calendar Heatmap. – Chris Handy, ClosedWon.
“If you use the campaigns functionality in HubSpot you will be able to show this heatmap data for groups of related emails like blog promotions, product updates, sales emails, etc.”

Track the top HubSpot Marketing metrics all in one dashboard
Want to easily track all of these HubSpot Marketing metrics in one place?
Download our free template and get started visualizing your data within minutes.
Want to see even more free HubSpot Marketing templates? Here’s a gallery of HubSpot-specific templates created by some of the most prolific users of the software in the space.