


Table of contents
Google Analytics metrics are essential for understanding your website’s performance and user behavior. If you used Universal Analytics (UA), you were familiar with its data tracking methods. But with the move to Google Analytics 4 (GA4), everything has changed. GA4 offers a new way to track data, providing deeper insights and more accurate analysis. Are you tracking the right metrics to make the most out of GA4?
Starting July 1, 2023, Google stopped processing data for standard UA properties. For 360 properties data processing and Universal Analytics access continued until July 1, 2024. Now, GA4 has fully taken over, and UA services and APIs are no longer available.
This shift means businesses need to adapt to GA4’s event-based tracking and new metrics. This guide will show you which metrics to track in GA4 and how they differ from those in UA. Each section will help you better understand how to adapt and make the most of GA4.
Ready to explore GA4’s metrics? Let’s dive in.

If you’re a marketer still adapting to GA4 and need guidance to understand how its metrics and approach differ from Universal Analytics, this guide will help you navigate the changes and make the most of GA4.

Let’s dive right in.
- Google Analytics Metrics and Dimensions vs GA4
- Types of Metrics in Google Analytics and GA4
- 11 Most Tracked Metrics in Google Analytics and GA4
Understanding Google Analytics 4 (GA4)
Google Analytics 4 (GA4) is the latest version of Google’s web analytics platform, designed to provide a more comprehensive and flexible approach to tracking user behavior across websites and apps. GA4 uses an event-based data model, which allows for more detailed and customizable tracking compared to the session-based model of Universal Analytics.
What Is a Metric in Google Analytics?
A metric in Google Analytics is a number that shows how well your website or app is doing. It helps you measure things like how many people visit your site, how long they stay, or how many take specific actions, like signing up for a newsletter. In GA4, metrics work with dimensions (which describe characteristics of your data, like where users came from or which device they used) to help you understand how visitors use your site and how well it’s performing. For a deeper understanding of how metrics and dimensions function together, you can refer to Google’s official guide on Dimensions and Metrics.
How Google Analytics Metrics Work for Web Analytics
Google Analytics metrics are numbers that show how visitors behave on a website or app. These numbers help you see different parts of how people interact with your site, like the average time they spend on pages, which indicates engagement levels and content effectiveness.
Web analytics is the process of collecting and looking at data to understand how visitors use a website. It helps businesses know what visitors do, see how well the site is working, and make changes to improve the user experience. Google Analytics is one of the most popular tools for web analytics. It gives important numbers (metrics) that help website owners and marketers understand how their site is doing.
GA metrics provide insights into various aspects of user interaction, such as:
- Traffic volume (e.g., Users, Sessions)
- Engagement (e.g., Average Session Duration, Pages per Session)
- Conversion (e.g., Conversion Rate, Goal Completions)
- Acquisition (e.g., Traffic Sources, Channels) – This one is especially important from our experience as it helps identify where your visitors are coming from, such as search engines, social media, or direct visits. This is crucial for understanding which marketing campaigns are driving the most traffic and engagement.
Metrics are calculated based on the data collected from user interactions, which are processed and aggregated by Google Analytics. The way data is collected directly influences the accuracy and depth of your reports.
Once you’re tracking the right GA4 metrics, the bigger challenge is interpreting how they relate to each other. For example, a drop in engagement rate alongside steady traffic can mean something very different than a drop tied to a specific channel or device. Teams now use AI data analysts, like Databox MCP, to ask plain-English questions about performance and get answers based on their real metrics, definitions, and historical data. This makes it easier to understand why changes happened and how different GA4 metrics connect to actual business outcomes.
Google Analytics Metrics and Dimensions vs GA4
Google Analytics 4 (GA4) differs significantly from Universal Analytics (UA) in terms of its focus and the way it processes and presents data.
Here are the key differences:
- UA revolves around sessions and pageviews as primary data points for analysis, while GA4 centers around tracking and processing events
- Metrics in GA4 have a single scope (Event), while dimensions can have two scopes (Event and User)
When you switch to GA4, you’ll also notice some new metrics are available, and some are missing, due to the new way the tool approaches data.
GA4 introduces new metrics like Engaged Session (counting sessions meeting specific criteria), Average Engagement Time per Session (measuring time spent on a specific page), and Engagement Rate (Engaged Sessions divided by total sessions), which were not available in UA.
At the same time, Bounce rate, which was prominent in Universal Analytics, is absent from GA4.
Expert Insight: If you find GA4’s interface confusing, you can streamline the way you track all these metrics with Databox. Check out our, customizable web analytics dashboard templates and start tracking website traffic, engagement, and more.
Types of Metrics in Google Analytics and GA4
GA4 metrics can be divided into two primary types: default and custom metrics.
Default metrics in Google Analytics 4 are those that you can use right away as they’re already set up. They include metric sub-categories like acquisition metrics, engagement metrics, and monetization metrics.
For example:
- New users, engaged sessions, and event count belong to the acquisition metrics category
- Users, views, and views per user represent engagement metrics
- Item views, add to carts, and purchase revenue are examples of monetization metrics
There are also custom metrics, which represent those set up by users who want to measure GA4 dimension attributes that aren’t already available.
For instance, “number of video views” if your website homepage includes a video.
PRO TIP: How to Monitor and Evaluate Your SEO Performance
If you want to understand how your visitors are behaving on your landing pages, there are several on-page events and metrics you can track from Google Analytics 4 and Google Search Console that will help:
- Organic clicks by queries. Which search queries generate the most clicks to your website?
- Organic clicks by page. Which pages receive the most clicks from search results pages?
- Organic sessions. How many organic search sessions does your website receive?
- Organic engaged sessions. How many website visitors were engaged with your content? An engaged session lasts longer than 10 seconds, has a conversion event, or has at least 2 pageviews or screenviews.
- Views per channel. Which channels generate the most views to your website?
And more…
Now you can benefit from the experience of our SEO and website conversion experts, who have put together a plug-and-play Databox template showing the most important metrics for monitoring your landing page performance. It’s simple to implement and start using as a standalone dashboard or in marketing reports!

You can easily set it up in just a few clicks – no coding required.
To set up the dashboard, follow these 3 simple steps:
Step 1: Get the template
Step 2: Connect your Google Analytics 4 and Google Search Console accounts with Databox.
Step 3: Watch your dashboard populate in seconds.
11 Most Tracked Metrics in Google Analytics and GA4
If you’re about to switch to tracking Google Analytics 4 metrics to better understand your website performance, here are the key ones to add to your dashboard. To help you get a better picture of what you’ll find in GA4, we’ll also explain how the new metrics differ from the ones you used to track in Universal Analytics.
- Users
- Bounce Rate
- Sessions
- Average Session Duration
- Percentage of New Sessions
- Sessions by Channel
- Pages Per Session
- Event Count
- Pageviews
- Conversions
- Engagement Rate
Users
In Google Analytics, this metric used to designate the number of unique website visitors. But what does “Users” metric measure in GA4, this metric has evolved and consists of three metrics:
- Total users: The total number of unique visitors to your website
- New users: The number of first-time visitors to your website, and
- Active users: The number of website visitors with an engaged session or for which GA4 collects certain parameters
Now, let’s take a step back to understand what an engaged session means. An engaged session lasts at least 10 seconds, has at least one conversion event, or involves at least two page or screen views.
The alternative condition a user should meet to be considered an active user is for GA4 to collect the first_visit event or engagement_time_msec parameter.
You may notice a difference between the calculations of “Users” metrics in UA and GA4 since the definitions are not the same, but Google claims discrepancies up to 20% are expected.
Recommended Datablock
To track users in Databox, Weidert Group’s Jonathan Stanis recommends the Line Graph Datablock with comparisons turned on:
“This Datablock is very useful in letting us see if any particular piece of content caused a spike in traffic or other general trends,” Stanis says. “December always tends to be a slow month for us, particularly between Christmas and New Years, and the ‘Users’ line graph clearly shows this trend.”

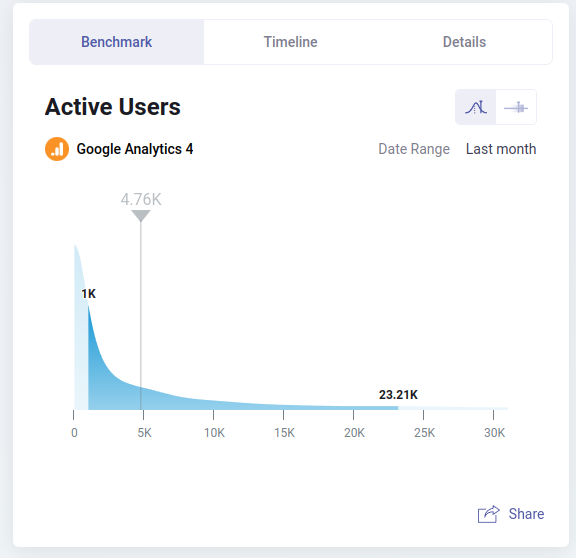
Benchmark
According to Databox’s own Google Analytics 4 benchmark report, the median value of Active Users for SaaS & B2B companies is 2.51K (a month).

For B2C companies, the median value is higher – 4.76K.
Expert Insight: Tracking User metrics can be simple with Databox. Use this Google Analytics 4 Acquisition Overview dashboard template to see where your users are coming from, how many new visitors you have every day, how much revenue they’re generating, and more.

Bounce Rate
Bounce rate was a notable metric in Google Analytics available in the main dashboard, that measured the percentage of visitors who visited a page on your website without interacting with it. In this case, the session duration was zero seconds.
However, the definition of bounce rate changed in GA4. Now, the bounce rate is the percentage of sessions that were not engaged. As we mentioned above, that means the session lasted less than 10 seconds, the user didn’t trigger any events (didn’t convert), or they didn’t open any new pages or screens.
In Universal Analytics, the bounce rate reflected the percentage of sessions where users viewed only one page, potentially overlooking deeper engagement on single-page applications. In Google Analytics 4, bounce rate signifies the percentage of sessions that lacked engagement criteria, offering a more nuanced view of user interactions, especially for content-focused sites like blogs where brief visits might still count as engaged sessions.
Maybe the simplest way to explain Bounce rate in GA4 is to say that it’s the inverse of the engagement rate.
Recommended Datablock
To track the bounce rate in Databox, Avidly’s Elise Karlsen Bye recommends the Line Graph Datablock with comparisons turned on.

Expert Insight: Unhappy with your website’s bounce rate? Try using an exit-intent pop-up to promote a special discount, a last-minute offer, or ask your website visitors for feedback. These tactics may lead to a reduced bounce rate.
Sessions
Sessions in Google Analytics were defined as periods of time during which a user actively engages with your website. A session was considered completed after 30 minutes of inactivity, after midnight, or due to new campaign parameters.
In GA4, however, there are a few changes:
- The metric is also called Session Start
- A new session generates an ID, which makes it easier to track all events that happen in that session
- The session does not automatically end at midnight (giving you a more precise number of sessions to work with)
The new way of measuring sessions has different implications for many types of businesses, for example, for global ones, considering that users from different time zones will be visiting their websites and be more likely to cross the midnight threshold.
Recommended Datablock
To track sessions in Databox, PR 20/20’s Keith Moehring recommends the Line Chart Cumulative Datablock with comparison and goals turned on:
“I like to see the day-by-day progress of this metric, and it’s often one with which we associate goals,” Moehring says.

Benchmark
According to Databox’s own Benchmark data, the median value of sessions for B2B and SaaS companies is 2.82K (a month).
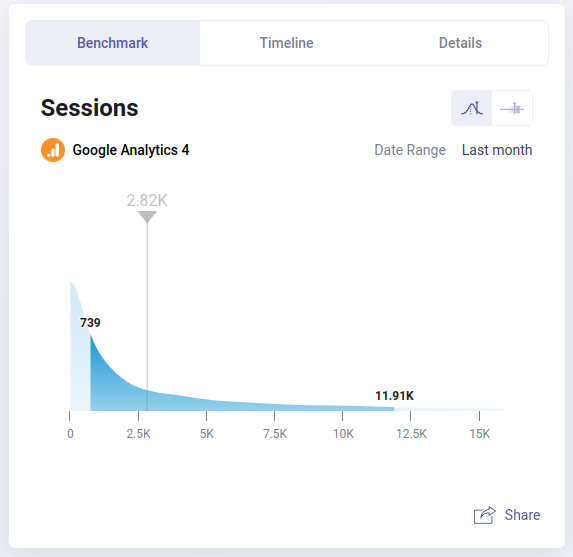
For B2C companies, the median value is 4.34K.

Expert Insight: You can track all your relevant Google Analytics 4 KPIs in one streamlined screen with this Databox GA4 KPI dashboard template. Monitor metrics such as Average Session Duration, Sessions, Sessions by Channel, and Session Conversion Rate, and quickly identify any emerging trends or bottlenecks in your website performance.

Average Session Duration
In Google Analytics, Average Session Duration used to measure the average length of a unique user’s visit on your website. You could calculate it by dividing the total session duration (in seconds) by the total number of sessions.
In GA4, the measurement of this metric, which kept the same name, is much more accurate. Before, UA used to measure the Avg. Session Duration in the same way for all sessions. It didn’t matter, for instance, if a user was running your webpage in the background.
Now, Avg. Session Duration uses the total duration of all engaged sessions to calculate the average session length, which gives you a more accurate idea on where you stand.
Recommended Datablock
To track average session duration in Databox, FCP Euro’s Amir Hamdi recommends the Audience Overview Datablock:

“As an e-commerce business, having all our website performance metrics available at a glance is critical,” Hamdi says. “The Audience Overview Datablock is the quickest way we can gauge site performance. As a bonus, I love being able to track metrics from Google Analytics and HubSpot in the same place.”
Expert Insight: The Average Session Duration benchmarks vary by industry, but if you’re looking to improve yours, consider improving your content format to make it more accessible and engaging. For example, you may add images or videos to your pages or simplifying and shortening your page copy to make it more digestible.
Percentage of New Sessions
New sessions are registered when there’s no client ID associated with a website visitor. The metrics “% New Sessions” refers to the total percentage of first-time sessions on your website during a specific time frame.
As Sessions are now measured differently (take a look at the explanation above), you may notice a difference in the number of new sessions in GA4—it may be lower because, for example, midnight doesn’t automatically end a session and start a new one.
Recommended Datablock
To track the percentage of new sessions in Databox, Imagine Business Development’s Doug Davidoff and Smartbug Media’s Juli Durante recommend the Line Graph Datablock with comparisons turned on:
“With the Line Graph Datablock, we’re able to quickly see how things are trending at any moment,” Davidoff says. “Depending on the strategy we’re implementing, we know if ‘% New Sessions’ is too high, then we’re not engaging enough visitors to come back. If it’s too low, we’re not attracting enough new visitors to the top of our funnel.”
“If you need to keep a database engaged long-term, seeing the line graph trend of repeat sessions is incredibly valuable,” Durante says.
“If you need to generate a ton of new leads, the graph will show you how your traffic may help you meet that expectation. If you’re unsure of whether or not existing customers are visiting your website and affecting your conversion rates, new sessions is another indicator of that.”

Sessions by Channel
UA used to define “Session by channel” as the number of sessions that can be attributed to different marketing channels. This allowed marketers to easily understand where most of their sessions are coming from: paid, organic, social, email, and other channels.
This metric is still available in GA4 in the Traffic Acquisition report. But, just like with other session-related metrics in Google Analytics 4, the number of sessions by channel may look different in GA4 due to the new way of measuring them.
Recommended Datablock
To track sessions by channel in Databox, The Weidert Group’s Jonathan Stanis recommends the Pie Chart Datablock:
“This helps show where the largest audiences are coming from and what channels are struggling,” Stanis says.

Another great option is bubble visualization.

Pages Per Session
Google Analytics calculated “Pages Per Session” by dividing the total number of pageviews by the total number of sessions. These pageviews are necessarily unique, as the same user could view a single page five times and it would be counted as five pageviews.
This is another metric affected by how sessions are measured. In GA, it’s still available by default, although it’s called Views per Session.
Recommended Datablock
To track pages per session in Databox, Prism Global Marketing Solutions’ Elyse Flynn Meyer recommends the Line Graph Datablock with comparisons turned on:
“An increase in pages per session is often a clear indicator that your website visitors are more engaged and are looking to explore more of your content,” Meyer says. “By having this visualization in Databox, we can quickly see trends for how user engagement is increasing or decreasing over time.”

Event Count
Event Count is a new metric that replaced Goal Completion from the old version of Google’s tool. It tracks the number of times users triggered an event on your website.
Events can include a variety of actions that may happen on a website from any industry, including user acquisition and engagement events (new user sign up, bounce rate, newsletter sign up), lead generation and conversion events (live chat interaction, completed contact form, demo request), and more.
GA4 allows you to dive deeper into your top events so that you can better understand your users’ journey and fine-tune it to better fit what they’re looking to learn or do on your website.
Benchmark
According to Databox’s own Benchmark data, the median value of event count for B2B and SaaS companies is 21.79K

For B2C companies, the median value is 33.35K.

Expert Insight: If you’re unsure which events to set up and track for your SaaS business, learn which are the essential ones to optimize your marketing funnel and how to track them in our Monthly Marketing Performance (HubSpot & GA4) dashboard template.

Pageviews
In UA, Pageviews were defined as the total number of pages viewed on your website. The tool counted even the repeated views of the same page.
As we mentioned, Pageviews are now Views in GA4. In the main dashboard, you can track Views, Views per session, and Views per user. However, it’s important to highlight that this metric now combines pageviews and screenviews, meaning that it also counts app screen views within the same metric (not separately as UA did).
Unique Pageviews is no longer available in GA4.
Recommended Datablock
To track pageviews in Databox, Stream Creative’s Steve James recommends the Line Graph Datablock with comparisons turned on:
“Pageviews is a key metric to ensure that new and returning visitors continue to access content on your website,” James says. “A solid SEO strategy along with social, email, and other campaigns can be measured in part by watching this metric.”
“With a custom dashboard software like Databox we can quickly compare and assess when we see a high number of pageviews and set up comparison data with our traffic sources and specific page results.”

Conversions
In Google Analytics, you had to designate specific user actions as goals to consider them a conversion. UA is able to count only one conversion per session for the goal you’ve specified.
Instead of goals, you specify conversion events in GA4. However, GA4 typically counts every conversion per session for your event. That means that if the same user submits their address for the newsletter two times, GA4 will count that as two conversions.
If you prefer one conversion per session per event way of counting, you can edit your conversion counting settings and choose Once per session.
Based on Databox’s research on how to track conversions in GA4, more than 75% of survey respondents believe GA4 is a better tool for tracking conversions.

In addition over 60% of our survey respondents stated that the additional options in GA4 for conversion tracking helped a lot.

Expert Insight: Tracking conversions in GA4 may come with a learning curve, but this guide with the top best practices, from setting up custom events to creating them for the entire customer journey, will surely help you get started.
Engagement Rate
As we’ve mentioned above, Engagement Rate is one of the new metrics available in GA4. It tells you the opposite of what Bounce Rate uncovers: the percentage of engaged sessions on your website.
You can calculate this by dividing the number of engaged sessions by the total number of sessions during a specific time frame and then multiplying the result by 100.
You can find this metric under “Session.”
Benchmark
According to Databox’s own Benchmark data, the median value of engagement rate for B2B and SaaS companies is 53.52%

For B2C companies, the median value is 56.65K.

Expert Insight: You can easily track and measure the overall engagement on your website by using this, customizable Google Analytics 4 Engagement Overview dashboard template. By monitoring sessions, events, views, and more and filtering them based on device, page title, and other elements, you can quickly understand what prompts people to interact with your website and what fails to keep them around for longer.

Custom Metrics and Dimensions in GA4
GA4 allows for greater customization through custom metrics and dimensions:
- Custom metrics let you measure specific actions or values unique to your business.
- Custom dimensions allow you to segment your data in ways that are meaningful to your organization.
- These customizations enable more targeted analysis and reporting tailored to your specific business needs. Event tracking helps you monitor user interactions like button clicks, video plays, and downloads, making your data analysis more comprehensive.
Limitations of Google Analytics
While GA4 offers powerful analytics capabilities, it’s important to be aware of its limitations:
- Data sampling can affect accuracy for high-traffic websites.
- Privacy regulations may limit data collection in certain regions.
- The learning curve can be steep for users transitioning from Universal Analytics.
- Some metrics from UA are not directly comparable in GA4 due to different measurement methodologies.
Integrating Google Analytics with Other Tools
To get the most out of your analytics data, consider integrating GA4 with other tools:
- Connect GA4 with Google Ads for more comprehensive advertising insights.
- Use Google Tag Manager to easily manage and deploy tracking tags without modifying your website’s code, simplifying data collection and updates.
- Use the GA4 API to pull data into custom dashboards or reporting tools (used for Databox).
- Integrate with CRM systems to tie website behavior to customer data.
- Combine GA4 data with social media analytics for a holistic view of your digital presence.
Best Practices for Analyzing Google Analytics Data
To make the most of your GA4 data:
- Set clear goals and KPIs aligned with your business objectives.
- Regularly review and update your event tracking to ensure you’re capturing relevant data.
- Use segments to analyze different user groups and behaviors.
- Leverage GA4’s machine learning capabilities for predictive insights.
- Combine quantitative data from GA4 with qualitative data from user feedback and surveys.
- Continuously test and optimize based on your analytics insights.
Simplify Website Analytics with Databox
While some website analytics tools can initially be overwhelming, we’ve built Databox to make things simple from the start.
Our business analytics platform allows you to monitor and report on your business performance in a streamlined manner, on any device, and by collecting data from any source. You will finally be able to remove all your least favorite activities from your plate, like:
- Spending hours on building complex reports that few people will actually understand
- Wasting precious minutes logging in and out of tools to collect the data you need
- Tracking goals in a spreadsheet and updating them manually
- Waiting until the end of a campaign to see what worked and what didn’t
Your solution for all of the above is in Databox:
- Gain access to time-saver templates and automation features
- Connect your entire toolkit to our platform through powerful integrations
- Easily set goals for your most important metrics and visualize progress in our tool
- Get notified when your performance is off track and tweak your campaigns before they end
Is this exactly what you were looking for? Sign up for a free trial today and get started!


