Uses one-click integrations:
-
 Google Business Profile
If you don't use Google Business Profile, you can pull data from any of our 130+ one-click, native integrations or from spreadsheets, databases and other APIs.
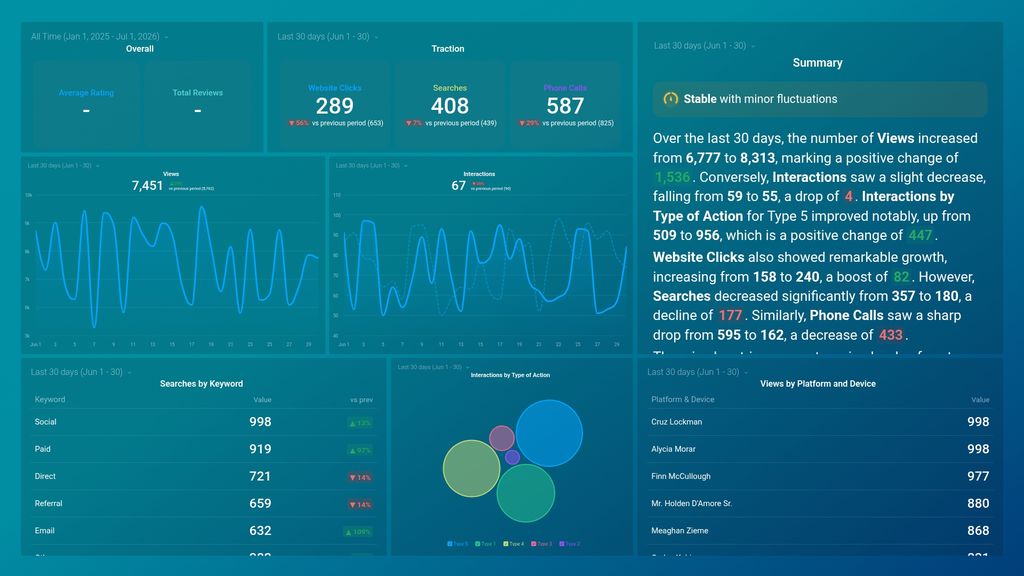
Try this dashboard for freeWhat you’ll learn from this Google My Business Insights dashboard template:
This dashboard template will allow you to have greater visibility and more control over how your business is displayed in search results. Connect your Google My Business account and learn:
- How many people viewed my listing? Track the total number of views your Google My Business listing received during a time period. Keep an eye on traffic trends daily for sudden spikes or dips in traffic.
- How many Google my business searches did we receive this month? View the number of times prospective or current customers searched for your business and see how the total number of searches for the current month compares to the previous month.
- How can I track the actions customers are taking on my listing? Track which customers’ actions are taken on seeing your business listing, such as website clicks, clicks to call, direction, etc. Monitor this data daily to discover which actions are most popular to optimize your profile accordingly.
- How many calls did we receive this month? View the number of calls your business received from customers through your business listing compared to the previous month. Did you receive more calls? If yes, can this be attributed to certain changes you made?
- Which sources drive the most searches for my business? Find out which sources your customers mostly use to find your business listing on search. It is important to track this as it helps you know which traffic sources to prioritize and which ones need to be worked on.
- How many actions were carried out on my business listing this week? View the total number of actions taken by customers on seeing your listing, such as the sum of visits, calls, directions, etc.
Pull additional data using our deep integration with Google My Business.
What else can you track and visualize with our deep integration with Google My Business? When it comes to your local search ranking and customer acquisition, almost anything:
-
- Search queries
- Customer engagement
- Ratings & reviews
- Call tracking
- Paid advertising
- Location tracking
There are many, many different metrics and metric combinations you can track using Google Universal Analytics. And in Databox, you can quickly visualize 100s of Google Universal Analytics metrics in a variety of different ways.
Read more about Databox’s Google My Business integration.
Explore more Google My Business dashboards.
Google Business Profile metrics included in this template
-
Average Rating
The Average Rating metric is a summary of all the ratings gathered from customers for a business on Google My Business. It's displayed as a numerical average rating score from 1 to 5 stars.
-
Total Reviews
Total Reviews is a metric that measures the total number of reviews received by a business on their Google My Business listing, including both positive and negative feedback from customers.