Uses one-click integrations:
-
 Google Analytics 4
-
 HubSpot Marketing
-
 Mixpanel
If you don't use Google Analytics 4, HubSpot Marketing or Mixpanel, you can pull data from any of our 130+ one-click, native integrations or from spreadsheets, databases and other APIs.
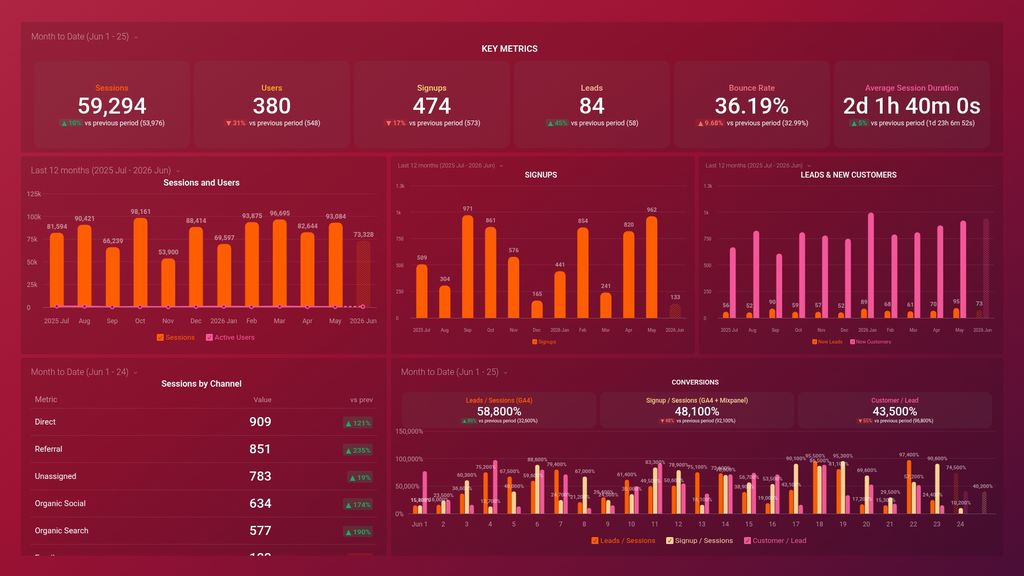
Try this dashboard for freeWhat you’ll learn from this SaaS Marketing Dashboard (CMO) Dashboard Template:
Connect your Mixpanel, Hubspot Marketing, and Google Analytics 4 accounts and learn:
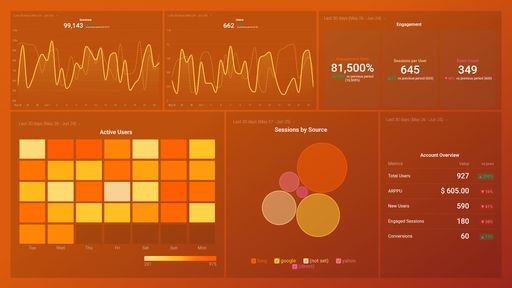
- How many new customers signed up last month? Keep track of your new paying customers anytime, anywhere. See how many people have newly signed up to make a purchase or tried your product or service. Compare this data to the same time period in the previous week/month/year. Are you gaining enough customers to keep your pipeline full?
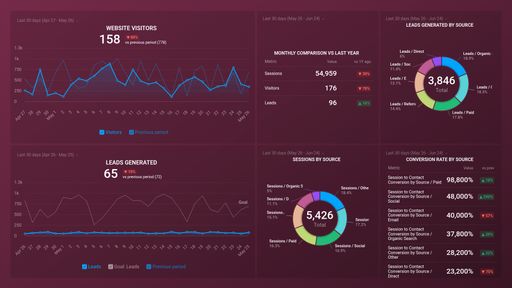
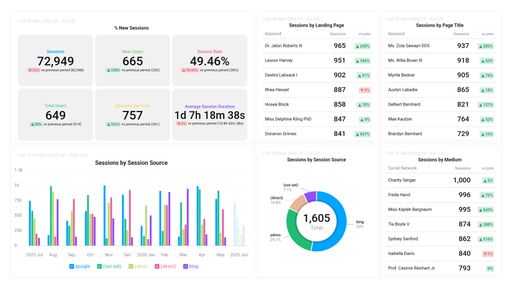
- Which channels bring in the most sessions? Identify the specific channels that bring in the most sessions to your website. This will help you focus your efforts where you are most likely to see more conversions based on the increasing the number of sessions. Whether it is upping your Paid Social channels or investing more in getting more Organic traffic.
- How many leads and new customers do you currently have? Keep track of both your leads and new customers month over month. See how the numbers interact and get insights into how many leads turn into customers.
- How engaged are your users? Is your website content interesting to visitors? Learn about your bounce rate, average session duration, and the percentage of new users. This will give you an overall insight into how your website is performing.
What else can you track and visualize with our deep integration with Mixpanel, Hubspot Marketing, and GA4?
When it comes to attributing your to sessions and conversions, almost anything:
- Impressions, clicks, and conversions
- Cost analysis
- Website and app engagement
- Conversion analysis
- Monitor audience growth over time
- Landing page performance
. There are numerous metrics and metric combinations you can track using Mixpanel, Hubspot Marketing, and GA4. And in Databox, you can quickly visualize dozens of Mixpanel, Hubspot Marketing, and GA4 metrics in a variety of ways. Read more about Databox’s Mixpanel, Hubspot Marketing, and GA4 integrations.
Google Analytics 4 metrics included in this template
-
Sessions by Session Default Channel Group
The Sessions by Session Default Channel Group metric in Google Analytics 4 reports the number of sessions attributed to each default channel group, which categorizes traffic sources such as organic search, social media, paid search, and direct traffic.
-
Active Users
The Active Users metric in Google Analytics 4 counts the number of unique users who have engaged with your website or app during a specific time period.
HubSpot Marketing metrics included in this template
- Lead to Customer Conversion Rate
-
New Customers
The New Customers metric tracks the number of first-time customers acquired within a specified time frame, indicating the success of a company's marketing and sales efforts.
- Leads / Sessions (GA4)
Mixpanel metrics included in this template
- Signups
- Signup / Sessions (GA4 + Mixpanel)