What you’ll learn from this AI-Generated Search Traffic Overview dashboard template
By connecting your Google Analytics 4 account, you’ll learn:
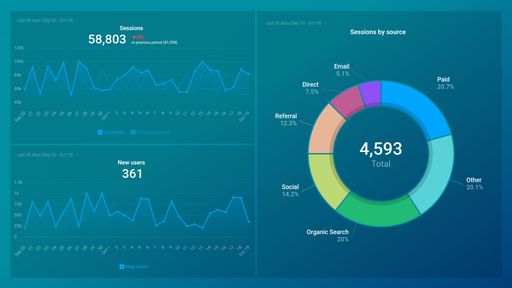
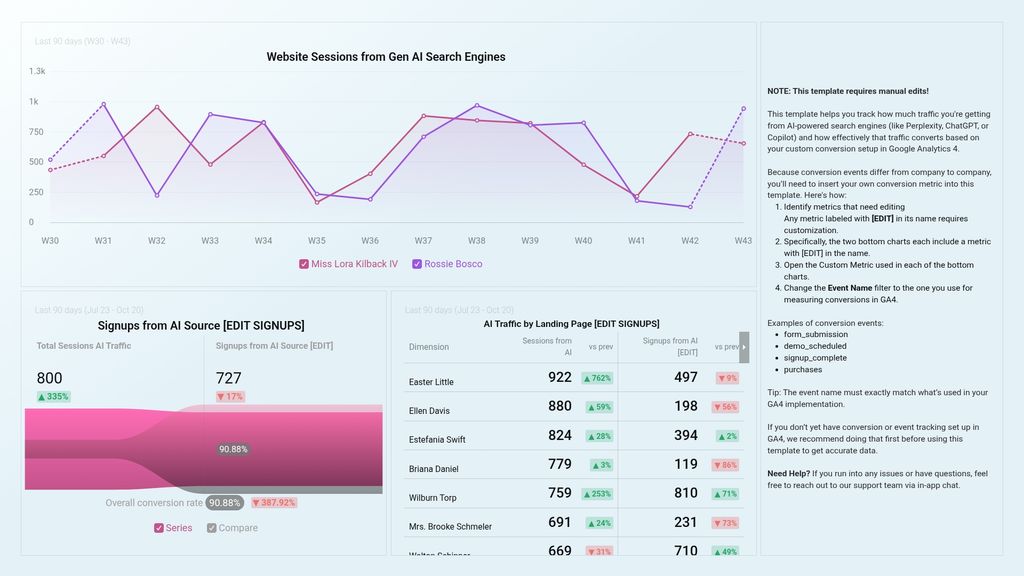
- How is traffic from AI search engines trending over time? Track the number of website sessions coming from AI-powered search platforms like Google SGE, Bing Copilot, and Perplexity. Monitor performance daily, weekly, or monthly, and compare to previous periods to see if AI traffic is growing.
- Are users from AI sources converting into signups? Understand how many visitors who arrived via AI search engines are converting into free trial or product signups. Use this insight to validate the quality and intent behind this growing traffic channel.
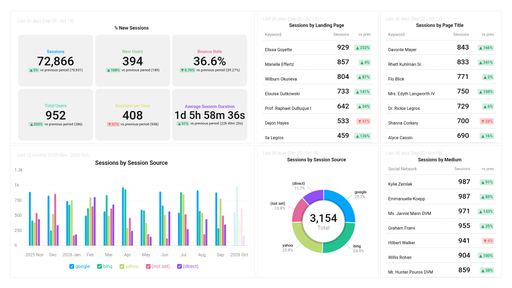
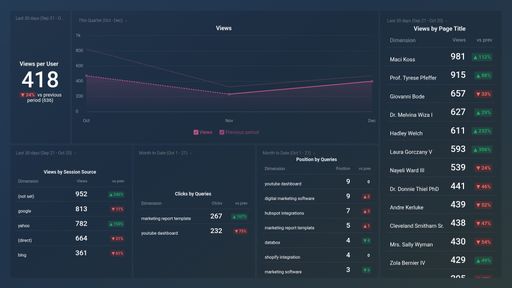
- Which landing pages attract the most AI search visitors? Identify which of your web pages are driving the highest number of sessions from generative AI sources. Double down on high-performers and optimize low-performing pages that show up in AI search results.
- How does AI search traffic compare to other traffic sources? Measure how engaged AI visitors are by comparing bounce rate, session duration, and conversion rates to other traffic sources like organic, paid, and social. Get a better sense of traffic quality and behavior.
What else can you track and visualize with our deep integration with Google Analytics 4?
When it comes to attributing to your traffic and conversions, almost anything:
- Traffic and lead demographics
- Sales revenue
- Mapping out the customer journey
- Calculate average revenue per user/ARPU
- Website and app engagement
- Purchase paths of your users
- Landing page performance
- Monitor audience growth over time.
There are many, many different metrics and metric combinations you can track using Google Analytics 4. And in Databox, you can quickly visualize 100s of Google Analytics metrics in a variety of different ways. Read more about Databox’s Google Analytics 4 integration.