Uses one-click integrations:
-
 Google Analytics 4
-
 Google Search Console
If you don't use Google Analytics 4 or Google Search Console, you can pull data from any of our 130+ one-click, native integrations or from spreadsheets, databases and other APIs.
Try this dashboard for free
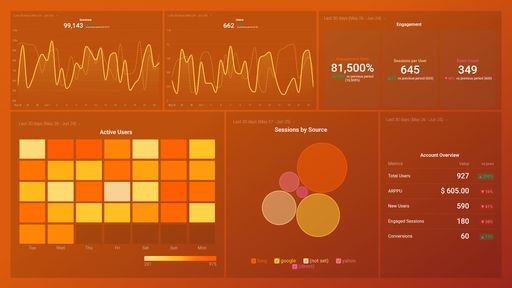
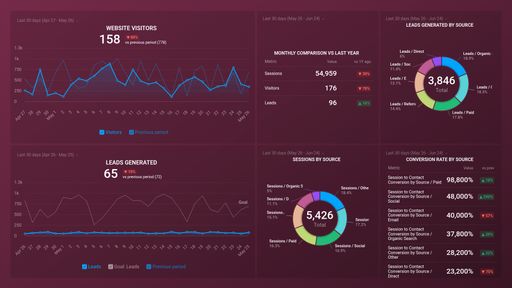
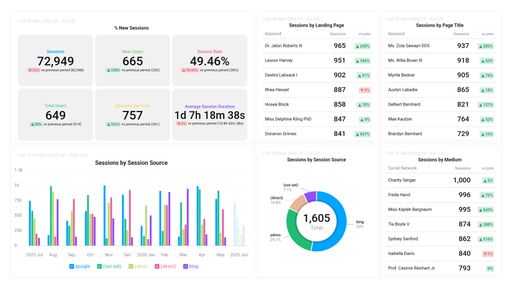
Google Analytics 4 metrics included in this template
-
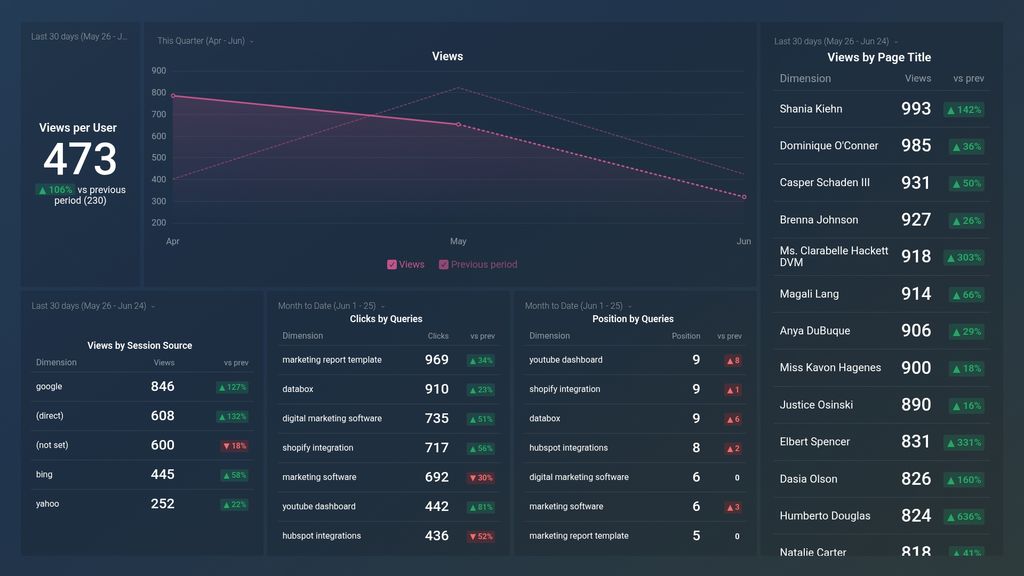
Views by Session Source
The Views by Session Source metric in Google Analytics 4 measures the number of page views generated by each traffic source, including direct, organic search, social media, email, and referral traffic, within a single session.
- Views per User