Uses one-click integrations:
-
 Google Analytics 4
-
 SEMrush
If you don't use Google Analytics 4 or SEMrush, you can pull data from any of our 130+ one-click, native integrations or from spreadsheets, databases and other APIs.
Try this dashboard for freeWhat you’ll learn from this SEMrush & GA4 Keywords & Organic Search Traffic Dashboard Template
By connecting your SEMrush and Google Analytics 4 accounts, you’ll learn:
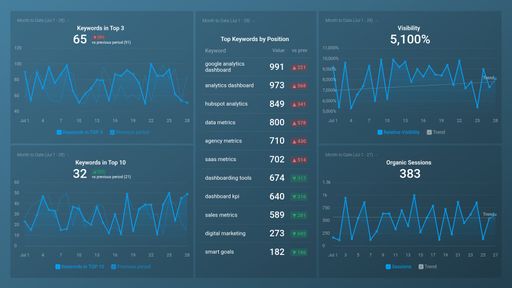
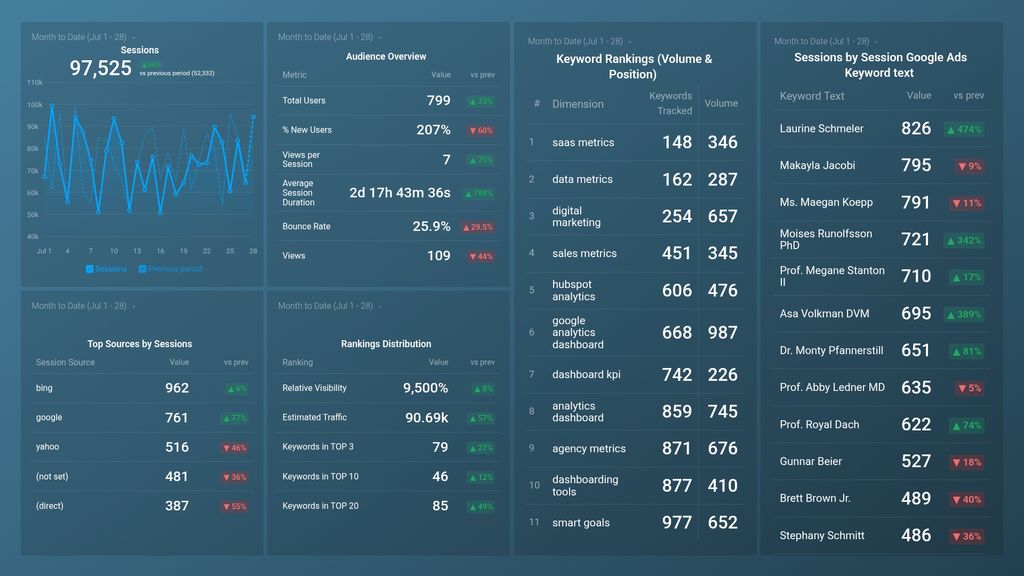
- How well is your website ranking? There are different parameters when we talk about ranking, when monitoring ranking distribution, you can get angst into estimated traffic, relative visibility, and the number of keywords that you have in TOP 3, TOP 10, etc. That way, you can take immediate steps to improve your strategy if you see a drop in one or all of these trends.
- If your sessions are trending up or down on a daily/monthly/quarterly basis? Track the number of sessions your website is getting on a regular basis. By comparing this number to previous periods, you can gain more insights and take appropriate steps to ensure that it continues to go up rather than stagnate or decline.
- Discover how visible your domain is among searchers for keywords in your campaign. By viewing your visibility trend, you can see in real time the website’s progress in Google’s top 100 for the keywords from your current tracking campaign. This will help you decide if you need to add additional effort into optimizing for those keywords.
- How engaged is your audience? Learn about your bounce rate, average session duration, and the percentage of new users. This will give you an overall insight into how your website is performing.
- How well is your website keyword optimization performing? Discover which keywords you rank the highest for. Often you will need to take steps to better optimize your pages if you don’t see your target keywords in this metric.
Pull additional data using our SEMrush and GA4 Integrations
What other campaign metrics can you track and visualize with SEMrush and GA4?
SEMrush -
- Visibility trend
- Keyword rankings
- Estimated traffic
- Rankings distribution
- Site errors and warnings
- Incoming internal links
- Competitor intelligence and more
Google Analytics 4 -
- Website Engagement
- Sales revenue
- Mapping out the customer journey
- Calculate average revenue per user/ARPU
- Website and app engagement
- Purchase paths of your users
- Landing page performance
- Monitor audience growth over time and more
There are many different metrics and metric combinations you can track using these integrations. And in Databox, you can quickly visualize dozens of SEMrush metrics in a variety of different ways.
Read more about SEMrush and Google Analytics 4 Integrations.
Google Analytics 4 metrics included in this template
-
Sessions by Session Google Ads Keyword Text
The Sessions by Session Google Ads Keyword Text metric in Google Analytics 4 measures the number of sessions in which a specific Google Ads keyword was responsible for driving traffic to a website. It helps marketers evaluate the effectiveness of their Google Ads campaigns and optimize them to improve their website's performance.
-
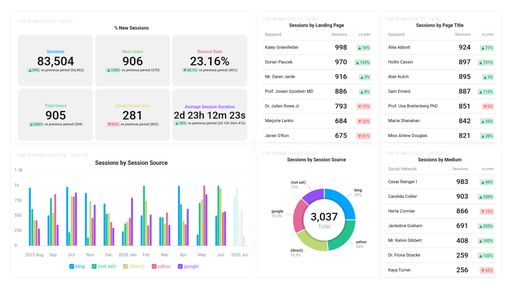
Sessions by Session Source
The Sessions by Session Source metric shows the number of sessions generated by different sources like direct traffic, organic search, referral, email, social media, paid search, etc., and helps in analyzing the effectiveness of various marketing channels in driving traffic to a website.