Uses one-click integrations:
-
 Google Analytics 4
-
 HubSpot CRM
-
 Stripe
If you don't use Google Analytics 4, HubSpot CRM or Stripe, you can pull data from any of our 130+ one-click, native integrations or from spreadsheets, databases and other APIs.
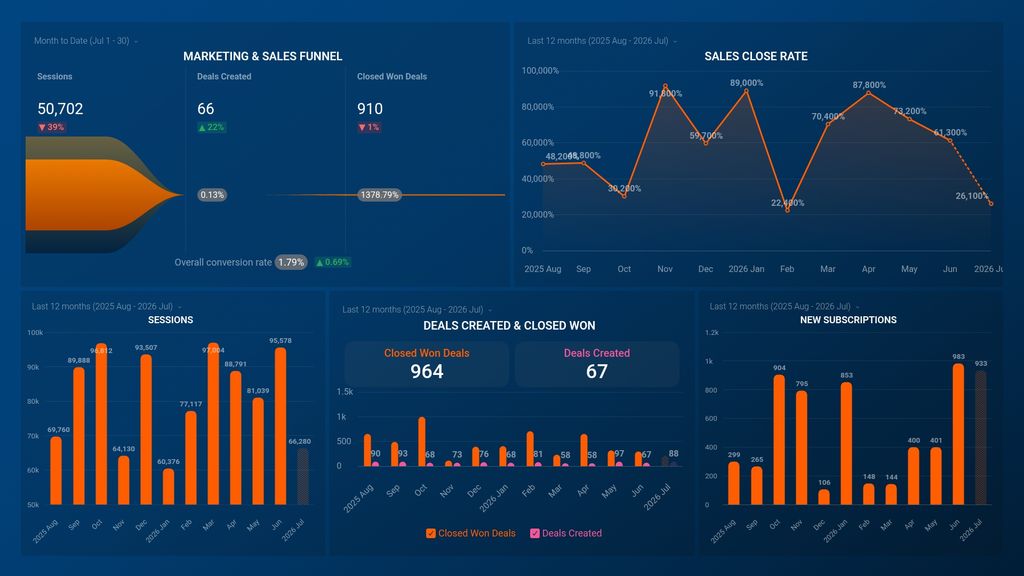
Try this dashboard for freeWhat you’ll learn from this SaaS Acquisition Funnel (GA4 + Mixpanel + Stripe) Dashboard Template:
By connecting your Google Analytics 4, Mixpanel, and Stripe accounts, you’ll learn the following:
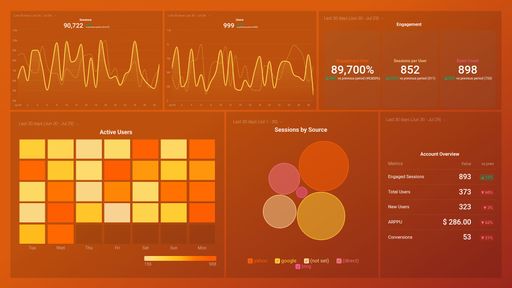
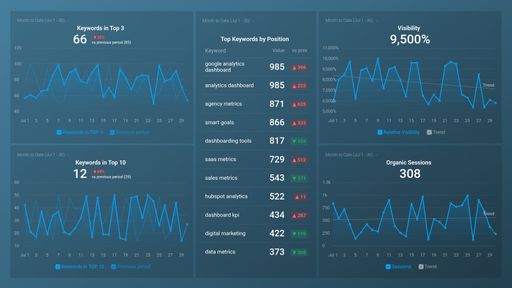
- How does your conversion rate change over time? Track your conversion rate month over month. This will help you take action if you see that there are significant changes, whether they are good or bad, drilling down and finding the cause can help shape your strategy.
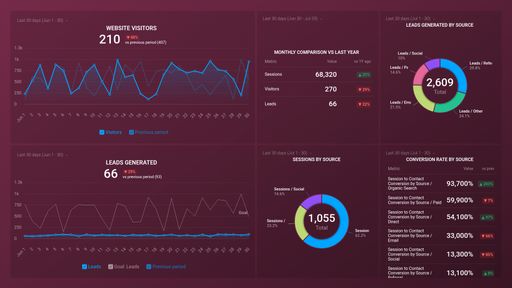
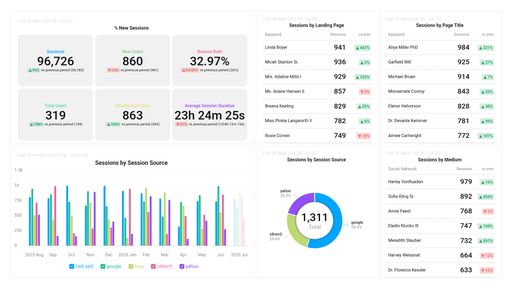
- Are your sessions trending up or down? Track the number of sessions your website is getting on a regular basis. By comparing this number to previous periods, you can gain more insights and take appropriate steps to ensure that it continues to go up rather than stagnate or decline.
- Track your acquisition funnel live. See how many of your sessions end up being new subscriptions and in which part of your funnel you lose the most potential users.
- Is the number of new subscriptions on the rise? Track the number of your new subscriptions monthly. By comparing this number to previous periods,you can see if there is a rising trend or are ther ups and downs. And then drill down and find out possible reasons.
What else can you track and visualize with our deep integration with Google Analytics 4, Mixpanel, and Stripe?
When it comes to attributing to your traffic and conversions, almost anything:
- Website Engagement
- Sales revenue
- Transactions
- Calculate average revenue per user/ARPU
- Open Invoices
- Purchase paths of your users
- Weekly retention rate
- Monitor audience growth over time.
There are many, many different metrics and metric combinations you can track using Google Analytics 4, Mixpanel, and Stripe. And in Databox, you can quickly visualize 100s of Google Analytics 4, Mixpanel, and Stripe metrics in a variety of different ways. Read more about Databox’s Google Analytics 4, Mixpanel and Stripe integrations.
HubSpot CRM metrics included in this template
- Closed Won Deals
Stripe metrics included in this template
-
New Subscriptions
The New Subscriptions metric tracks the number of new recurring payments or subscription sign-ups made by customers in a given period of time.