Uses one-click integrations:
-
 Google Ads
-
 SEMrush
If you don't use Google Ads or SEMrush, you can pull data from any of our 130+ one-click, native integrations or from spreadsheets, databases and other APIs.
Try this dashboard for freeWhat you’ll learn from this PPC Performance Overview Dashboard Template:
Analyze your campaigns, ad groups, keywords, and engagement metrics to improve your return on investment (ROI). By connecting your Google Ads and SEMRush accounts, you’ll learn:
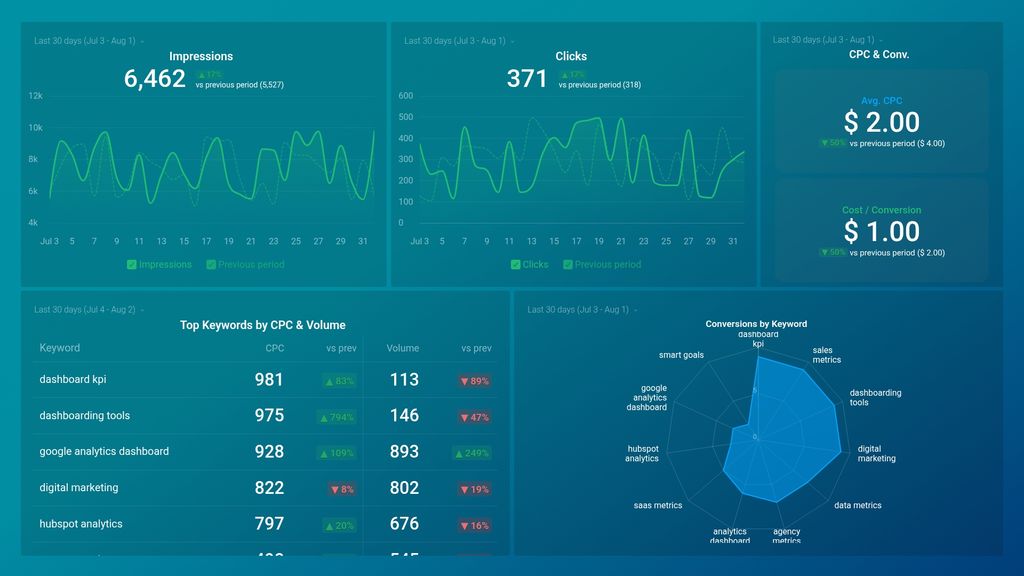
- Which keywords bring in the most conversions? Find out which keywords convert best so you can adjust your SEO strategy in real time and ensure that all your goals are met.
- How do you monitor your Ad Impressions data? View the total number of times your ad was shown/seen on Google within the specified date range.
- How many times was your ad clicked on? Visually monitor the number of clicks your ad receives daily. It helps track this data as it is a good indicator that your ad is compelling and valuable to prospective customers.
- How much do you pay for each click on your Ad? See the amount you pay on average for each click your ad receives. If your ad CPC is too high, you might want to consider alternative keywords to target, lower, and adjust your bids, make your ad more relevant, etc.
- How much, on average, does conversion on my ad cost? See how much you get charged for each desired action taken by a user after coming across your ad. Compare your cost per conversion value against your target amount to determine the return on your ad investment.
Pull additional data using our robust integration with Google Ads and SEMRush.
What else can you track and visualize with our deep integration with Google Ads and SEMRush? When it comes to analyzing your campaigns, pretty much anything:
- Impressions, clicks, and conversions
- Warnings
- Pages Markup
- Conversion analysis
- Engagement by Ad, Ad Group, and Ad Campaign, and more
There are numerous metrics and metric combinations you can track using Google Ads and SEMRush. And in Databox, you can quickly visualize dozens of Google Ads and SEMRush metrics in various ways.
Read more about Databox’s Google Ads and SEMRush integrations.
Google Ads metrics included in this template
-
Avg. CPC
Avg. CPC stands for Average Cost Per Click, which is the average amount of money an advertiser pays each time a user clicks on one of their ads. It is a key metric in Google AdWords and helps advertisers evaluate the effectiveness of their ad campaigns.
-
Conversions by Keyword Id by Campaign by Keyword
The Conversions by Keyword Id by Campaign by Keyword metric calculates the number of conversions generated by a specific keyword within a campaign, allowing for optimization of keyword targeting and budget allocation.
-
Cost / Conversion
Cost/Conversion is a Google AdWords metric that measures the amount of money spent on a campaign divided by the number of conversions (desired actions taken by users). This metric helps advertisers determine the efficiency of their campaigns and optimize them accordingly to achieve their conversion goals at a lower cost.
SEMrush metrics included in this template
-
Top Keywords by CPC
Top Keywords by CPC shows the most expensive keywords for advertisers to bid on in a particular region. It helps identify profitable niches where advertisers are willing to pay high prices.
-
Top Keywords by Volume
Top Keywords by Volume metric shows the most searched for keywords related to a website or topic, ranked by search volume. It helps identify popular keywords and topics to target for SEO and PPC campaigns.