Uses one-click integrations:
-
 Google Analytics 4
-
 SEMrush
If you don't use Google Analytics 4 or SEMrush, you can pull data from any of our 130+ one-click, native integrations or from spreadsheets, databases and other APIs.
Try this dashboard for free
SEMrush metrics included in this template
-
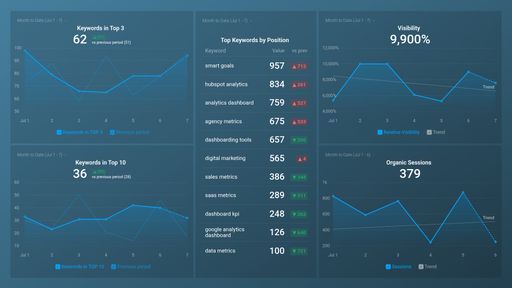
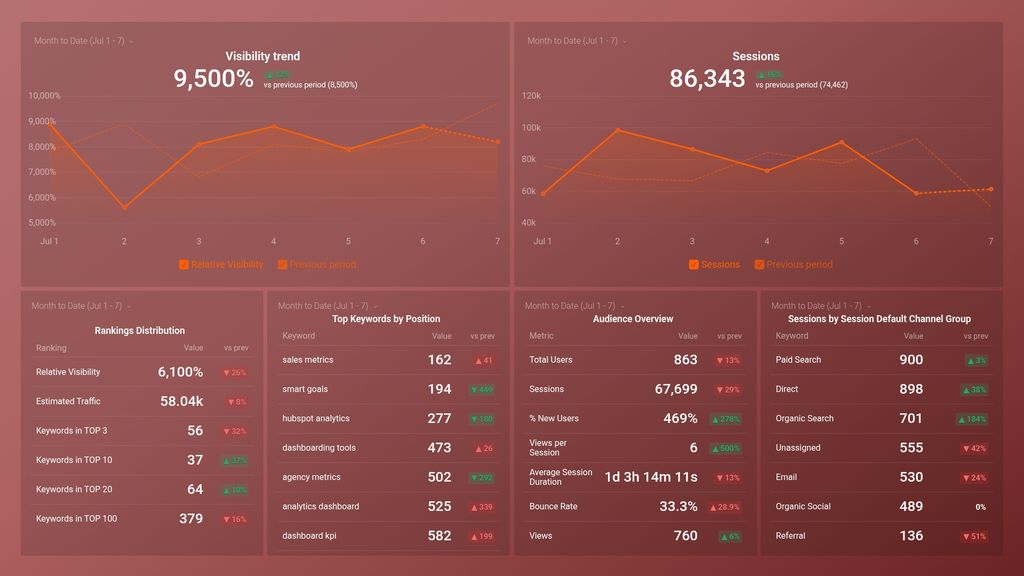
Top Keywords by Position (incl. Local, Hotel, excl. Business Name)
This metric shows the top keywords that bring traffic to a website, excluding those that include the business name. It includes both local and hotel searches, and displays the position of each keyword in search results.
-
Keywords in TOP 10
The Keywords in TOP 10 metric shows the number of organic search keywords for which a domain or URL ranks in the top 10 search results on Google. This helps to assess the search engine visibility and ranking performance of a website.
-
Keywords in TOP 100
Keywords in Top 100 is a SEMrush metric that shows the number of keywords for which a domain or URL ranks in the top 100 search engine results pages (SERPs). It helps to evaluate the domain's or URL's visibility and track SEO performance.
-
Keywords in TOP 20
Keywords in TOP 20 is a SEMrush metric that shows the number of keywords a website ranks for in the top 20 search engine results pages. It helps gauge a website's search visibility and SEO performance.
-
Keywords in TOP 3
Keywords in TOP 3 is a SEMrush metric that shows the number of keywords for which a domain or URL ranks in the top 3 search engine results pages. It indicates a site's visibility and potential traffic from high-ranking and relevant search queries.
-
Estimated Traffic
Estimated Traffic is a metric in SEMrush that shows the estimated monthly search traffic that a particular domain, subdomain, or URL receives from Google's organic search results.
-
Relative Visibility
Relative Visibility is a SEMrush metric that measures a website's visibility compared to its competitors in the same market, based on organic search results and the keywords they rank for.