Uses one-click integrations:
If you don't use SEMrush, you can pull data from any of our 130+ one-click, native integrations or from spreadsheets, databases and other APIs.
Try this dashboard for freeWhat you’ll learn from this SEMRush (Site Audit) Dashboard Template:
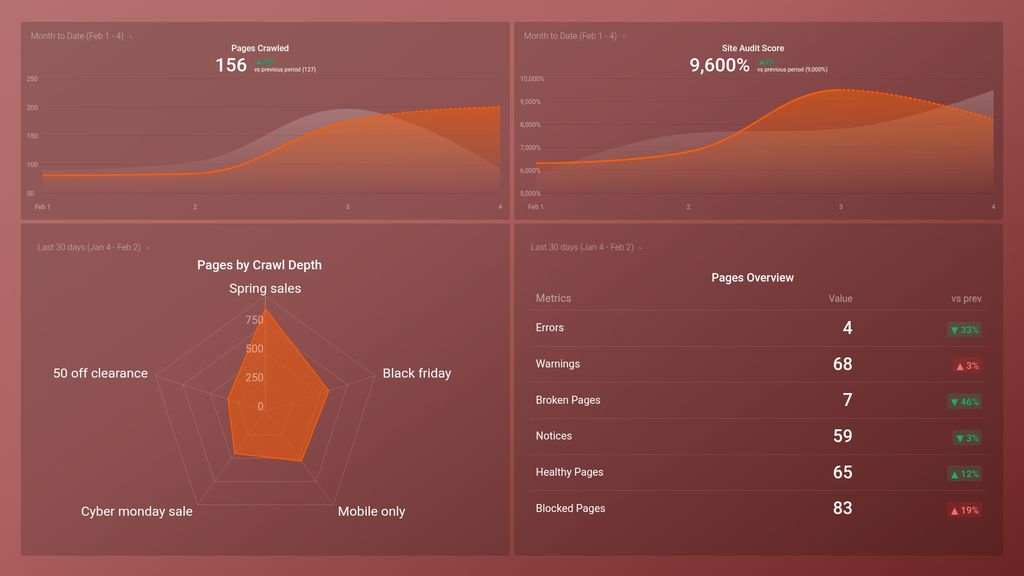
- How many pages on my site were crawled last month? View the number of pages that were crawled by search engines within a specified time period. If the number of pages stated in your sitemap.xml does not match the number of crawled pages, it is an indicator that your site might have crawlability issues, such as poor site structure, broken links, unsupported scripts, and so on.
- What is my site’s audit score? Assess your site’s health in terms of percentage (0% to 100%). Your site’s audit score is calculated based on the number of errors and warnings that were diagnosed when your web pages were crawled.
- How many issues were identified during my last site audit check? View the total number of diagnosed issues while auditing your website before they amount to more significant problems. These issues can be categorized as errors (most severe issues on your website), warnings (harmful issues), and notices (least harmful issues).
- How many pages found issues during my last site audit check? See how many pages were reported to have issues after conducting an audit for your website.
- How do I measure the click depth of my website? See how many clicks it takes for specific web pages to be accessed from your homepage i.e. 1 click, 2 clicks, 3 clicks, 4 clicks, and more.
Pull additional data using our SEMrush integration
What other campaign metrics can you track and visualize with SEMrush?
- Visibility trend
- Keyword rankings
- Estimated traffic
- Rankings distribution
- Site errors and warnings
- Incoming internal links
- Competitor intelligence and more
There are many different metrics and metric combinations you can track using these integrations. And in Databox, you can quickly visualize dozens of SEMrush metrics in a variety of different ways.
Read more about SEMrush integration..
- Blocked Pages
- Broken Pages
- Crawl Depth by Pages
- Errors
- Healthy Pages
- Notices
- Warnings
-
Pages Crawled
Pages Crawled metric in SEMrush represents the number of pages on a website that were crawled by the SEMrush bot during a specific time period. This metric gives an indication of the size and structure of a website, and helps to identify any crawling issues.
-
Site Audit Score
SEMrush Site Audit Score is a comprehensive metric that evaluates the technical health of a website and assigns a score out of 100, indicating critical issues, warnings, and recommendations for improvement.
