


Table of contents
People have opinions. That’s a fact.
When a client approaches our agency, Resolute PR, they typically have opinions about why their marketing is or isn’t working.
As they should….
Their boots-on-the-ground knowledge is vital to creating the right marketing strategy and succesful campaigns.

But just like everyone on this planet, some of the information they relay to us is skewed by their own bias. For example, who in the agency world hasn’t heard someone answer, “This product/service is for everyone,” when asked what audience they are targeting?

As a data-driven PR firm, we know that marketing based on opinions and anecdotal experience can really miss the mark. The good news is that it can be avoided by conducting online market research that threads various sources of data together in what Resolute calls a “digital landscape,” a more advanced version of your typical marketing audit.
Here are a 6 steps we take to put one together…
1- Gather data from multiple sources
Just like painting a picture, your data sources are essentially your color palette. Just like in art, the more colors you have, the more realistic the landscape becomes. That’s why data is king when creating a digital landscape. Once you gather many data points (mentioned below), you will use these actual facts about who is viewing your services or products in terms of when, why and how to make informed decisions.
So, to get started, make a list of the marketing tools that track the marketing metrics that eventually lead to company revenue. Some common data sources include
- SEMrush
- Google Analytics
- Social Networks
- HubSpot
- …and many more
We usually use only one tool for each type of marketing- social, organic, email, affiliate. The only exception is social media, where you may have a presence across 5 major social networks.
PRO TIP: How Are Users Engaging on My Site? Which Content Drives the Most Online Activity?
If you want to discover how visitors engage with your website, and which content drives the most engagement and conversions, there are several on-page events and metrics you can track from Google Analytics 4 that will get you started:
- Sessions by channel. Which channels are driving the most traffic to your website?
- Average session duration. How long do visitors spend on your website on average?
- Pageviews and pageviews by page. Which pages on your website are viewed the most?
- Total number of users. How many users engaged with your website?
- Engagement rate. Which percentage of your website visitors have interacted with a piece of content and spent a significant amount of time on the site?
- Sessions conversion rate. How many of your website visitors have completed the desired or expected action(s) and what percentage of them completed the goals you’ve set in Google Analytics 4?
And more…
Now you can benefit from the experience of our Google Analytics 4 experts, who have put together a plug-and-play Databox template showing the most important KPIs for monitoring visitor engagement on your website. It’s simple to implement and start using as a standalone dashboard or in marketing reports!

You can easily set it up in just a few clicks – no coding required.
To set up the dashboard, follow these 3 simple steps:
Step 1: Get the template
Step 2: Connect your Google Analytics account with Databox.
Step 3: Watch your dashboard populate in seconds.
2- Use SEMrush to see what keywords people are using to find you (and your competitors)
SEMrush is a powerful and versatile competitive intelligence suite for online marketing. It allows you to find to the keywords people type into a search engine that actually bring visitors to your site or your competitors’ websites. I’ve been using SEMrush for at least five years, and it has evolved a lot since I first started using it. I use it to look at several different metrics, including an analysis of the organic traffic that brings users to my client’s (and their competitors’) websites.
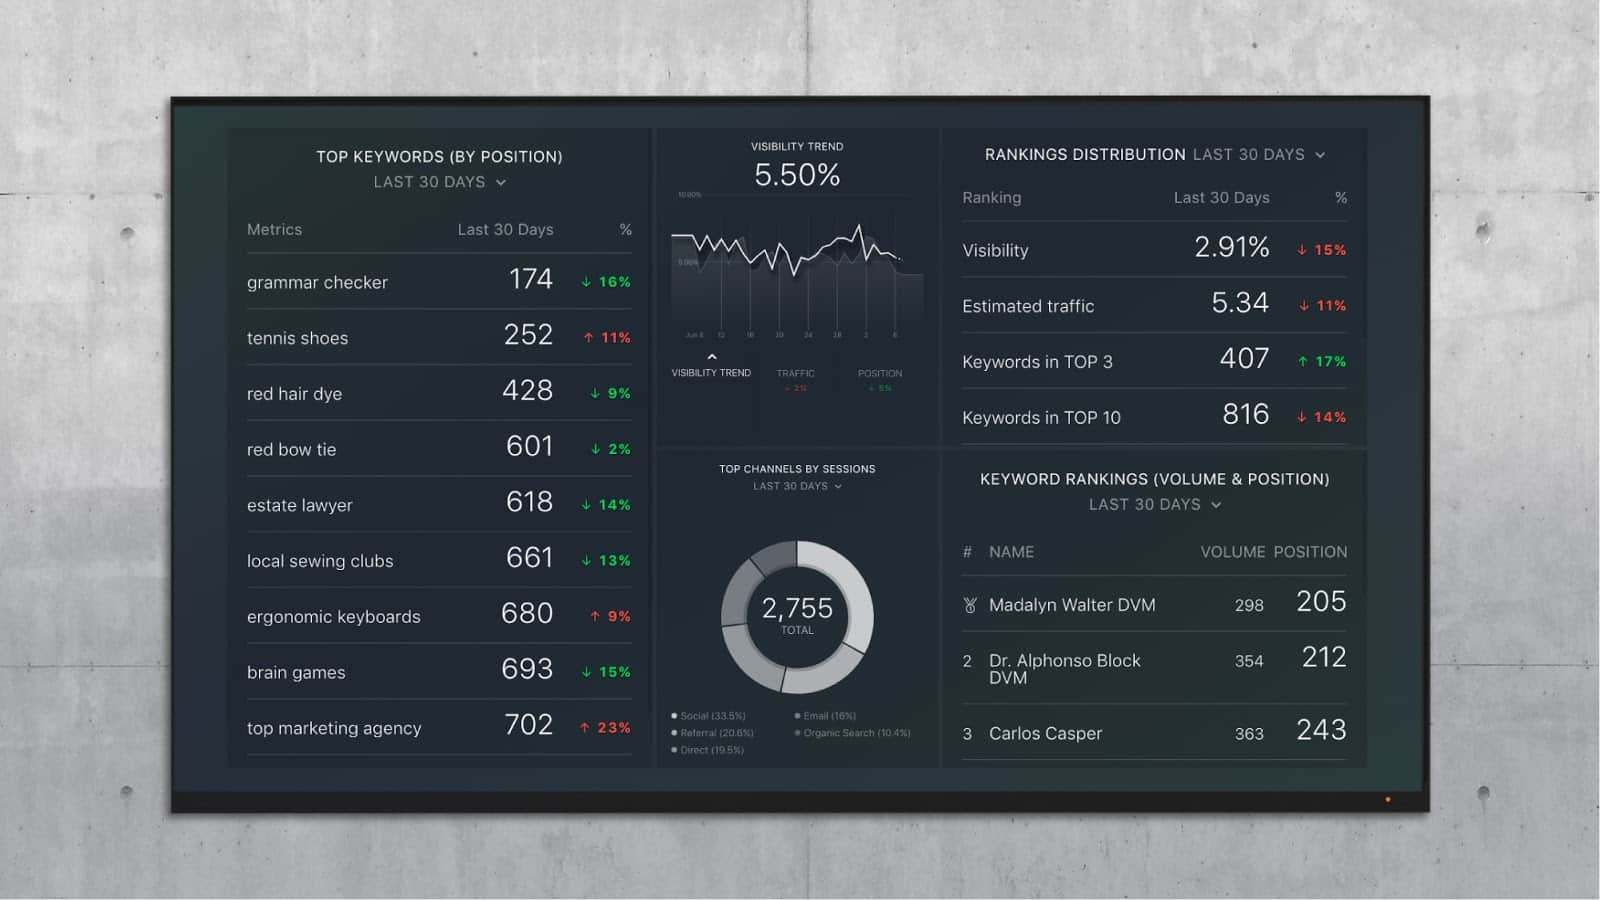
If you already have an SEMRush account, use the free SEMrush Keyword Mission Control dashboard from Databox (shown below) to learn which keywords are driving traffic.
There are quite a few things you can glean from SEMRush. For example, it will tell you the amount of branded organic traffic you get, which can give you a better understanding of how well people know your brand. For companies with a decent level of brand awareness, the brand name (in many variations) will be a high number of the organic keywords that bring people to the website. If it’s not, we sometimes use this data to recommend brand awareness building tactics.
The next thing I always like to pull into a digital landscape is competitive (or in some cases comparative) data. SEMrush is a treasure trove when it comes to looking at your competitors’ Google advertising. In the past, they allowed marketers to see the percentage of traffic the ads brought to the competitors’ website. I loved this because it allowed me to see the effectiveness of the keywords they bid on. The platform has since taken that feature away, but it still allows marketers to look at ad copy and history for both display and search. This data will also identify the keywords that competitors are targeting with each ad.
One word of caution when looking at this type of data. There are many organizations that task someone with, “Hey go run some Google Ads.” If you’re that person, don’t fall into the trap of bidding on x, y and z keywords just because your competitor is. It doesn’t mean it’s working for them and it may not work for you. Regardless, it’s still interesting to see which keywords trigger their ads.
3- Analyze website effectiveness via Google Analytics
Whenever someone asks me about Google Analytics, I always say, “Analytics is like Microsoft Excel. MS Excel is a very robust and powerful tool, but most people just know how to make a basic spreadsheet.” But, even though you don’t have to get too fancy to get insights from Google Analytics, it can be very powerful, especially if you sync it up to things like AdWords, Tag Manager and e-commerce tools.
The most important rule for Google Analytics (and really anytime you are analyzing data) is to look at your date range. I usually look at at least a year or longer of data if possible, since sometimes, making decisions based on a short date range can lead you down the wrong path.
The typical metrics I show in a digital landscape from Google Analytics are:
- User flow (choose a dimension to measure that’s most applicable)
- Bounce rate
- Device category
- Demographics
- Content drilldown (bounce rate, average time on page)
- Referral traffic
- Social network (I also like to include the secondary dimension of the URL shared)
- Most popular day of the week
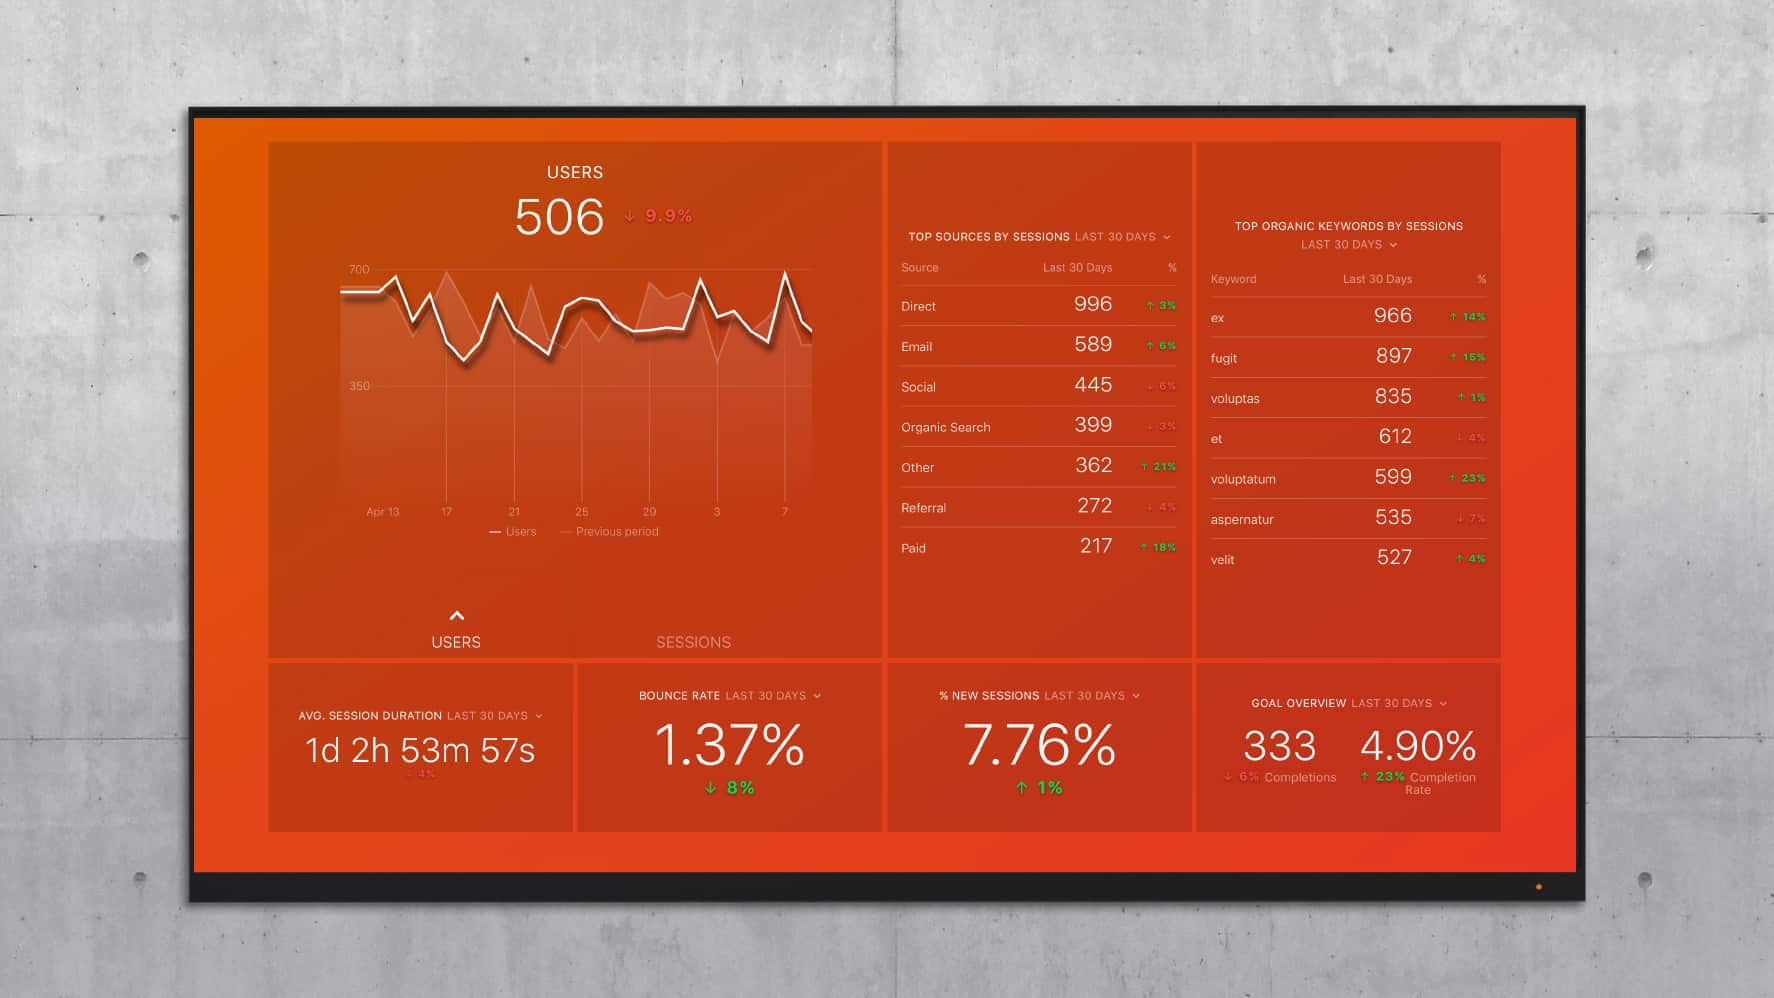
You can use Databox’s free Google Analytics Website traffic dashboard to immediately begin monitoring some of these metrics.
Want to learn more about how to use Google Analytics? Check out our comprehensive Google Analytics reporting guide that covers everything from functions and dimensions to reports and metrics.
4- Identify high-performing content via Facebook Page insights
As the media has highlighted very recently, Facebook, um, knows a lot about us and our online behavior. Facebook insights can give you a very powerful view into who is engaging with your brand online.
Your digital landscape should pull in data that looks at the demographic makeup of your page, fans, reach and engagement.
However, the metric I weigh the most (in terms of importance) is engagement. I love the simple but oh-so-painfully accurate quote by John Loomer in his blog post, Your Facebook Page Organic Reach is Dropping (But Not Really). He says:
“How Facebook reports on the number of people who ‘saw’ your post does not change the number of people who acted (reacted, commented, shared, clicked, converted) on it. These actions are what matter most. They are what you should be focused on.”
Here’s a Databox template that pulls your Facebook Page Insights for you.
When it comes to looking at Facebook posts, I also filter Facebook posts with the highest amount of engagement and ask myself the following questions:
- What was being communicated in these posts?
- What kind of creative accompanied them (video, slideshow, image etc.)?
- Was cross-promotion involved?
- What hashtags were used?
This helps me determinethe tactics that have truly worked for them in the past, build upon that messaging and gain a better understanding of what resonates with their audience.
5- Use ad platforms to determine who to target and how to target them
Gathering data from AdWords and Facebook Ads Manager (or Business Manager) is another extremely powerful source of data. The metrics I like to include from these sources are:
- Demographics
- Affinity audience (AdWords)
- Device where ad was viewed
- Placement breakdown (Ads Manager)
- Custom conversion of pixel activity
6- Create a clear presentation with dashboards
A long time ago, I had a client who told me that my data was “really overwhelming” after a presentation.
Once you gather all this data using a marketing dashboard software, the critical next step is putting together a clear presentation that’s not overwhelming.
The key, I’ve found, is to present the data in a visually appealing way. For some clients, putting together live marketing dashboards using Databox does the trick. For others, I work with my graphic designer to create a finished presentation.
Use Data to Validate Your Marketing Strategy
Once your social media dashboard is created, you’ll begin to see trends that were previously invisible in your marketing data. The clear picture creates actionable items. And these actionable items are based in real-world, real-time facts rather than the assumptions and opinions we carry around with us that they feel like facts.
For example, we’ve had clients who assumed they needed to do a large radio/TV push for a campaign only to realize after the digital landscape that the majority of their audience was much younger than they had thought. In addition, that audience primarily accessed their website and social media on their mobile devices. This allowed our client to re-allocate marketing dollars to include more mobile advertising than previously determined.
The digital landscape is always an eye-opening experience for our clients and the Resolute team. We learn so much from this research and ultimately craft a marketing strategy that is much more effective.
How are you using data to make sure your marketing strategy is the right one?


