Uses one-click integrations:
-
 Google Analytics 4
-
 SEMrush
If you don't use Google Analytics 4 or SEMrush, you can pull data from any of our 130+ one-click, native integrations or from spreadsheets, databases and other APIs.
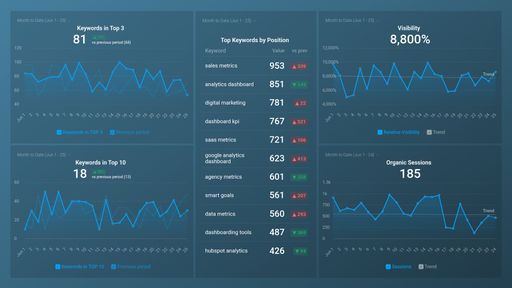
Try this dashboard for freeWhat you’ll learn from this SEMrush & GA4 Keywords & Organic Search Traffic Dashboard Template
By connecting your SEMrush and Google Analytics 4 accounts, you’ll learn:
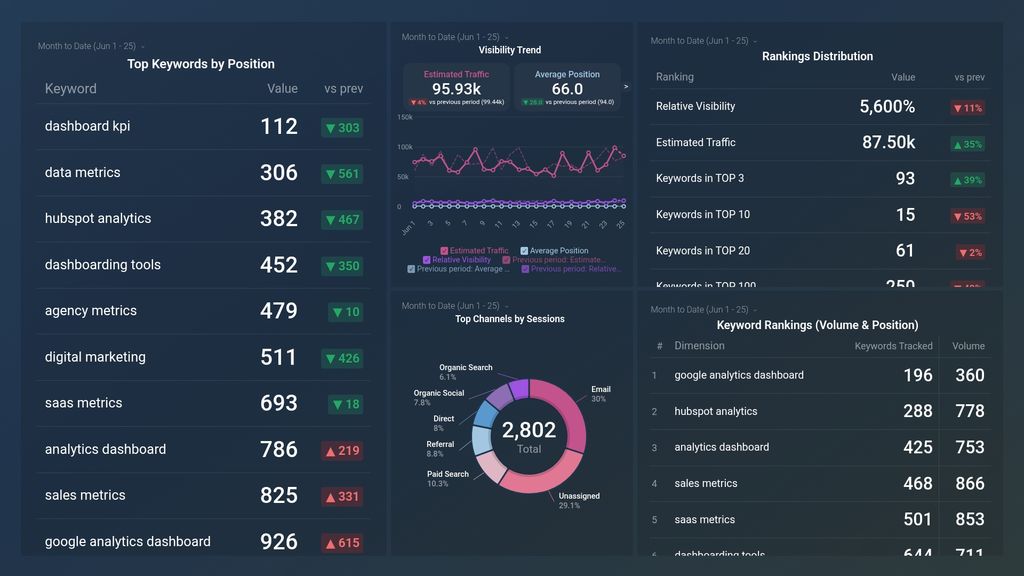
- How well is your website ranking? There are different parameters when we talk about ranking, when monitoring ranking distribution, you can get angst into estimated traffic, relative visibility, and the number of keywords that you have in TOP 3, TOP 10, etc. That way, you can take immediate steps to improve your strategy if you see a drop in one or all of these trends.
- Which channels bring in the most sessions for your website? Track the number of sessions your website is getting on a regular basis from different channels. This will help you decide which channels are worth investing in and which you can save money one in the long run.
- Discover how visible your domain is among searchers for keywords in your campaign. By viewing your visibility trend, you can see in real time the website’s progress in Google’s top 100 for the keywords from your current tracking campaign. This will help you decide if you need to add additional effort into optimizing for those keywords.
- How engaged is your audience? Learn about your bounce rate, average session duration, and the percentage of new users. This will give you an overall insight into how your website is performing.
- How well is your website keyword optimization performing? Discover which keywords you rank the highest for. Often you will need to take steps to better optimize your pages if you don’t see your target keywords in this metric.
Pull additional data using our SEMrush and GA4 Integrations
What other campaign metrics can you track and visualize with SEMrush and GA4?
SEMrush -
- Visibility trend
- Keyword rankings
- Estimated traffic
- Rankings distribution
- Site errors and warnings
- Incoming internal links
- Competitor intelligence and more
Google Analytics 4 -
- Website Engagement
- Sales revenue
- Mapping out the customer journey
- Calculate average revenue per user/ARPU
- Website and app engagement
- Purchase paths of your users
- Landing page performance
- Monitor audience growth over time and more
There are many different metrics and metric combinations you can track using these integrations. And in Databox, you can quickly visualize dozens of SEMrush metrics in a variety of different ways.
Read more about SEMrush and Google Analytics 4 Integrations.
SEMrush metrics included in this template
-
Relative Visibility
Relative Visibility is a SEMrush metric that measures a website's visibility compared to its competitors in the same market, based on organic search results and the keywords they rank for.
-
Average Position
The Average Position metric in SEMrush measures the typical rank of a website's organic search results for targeted keywords over a certain period.
-
Top Keywords by Position (incl. Local, Hotel, excl. Business Name)
This metric shows the top keywords that bring traffic to a website, excluding those that include the business name. It includes both local and hotel searches, and displays the position of each keyword in search results.
-
Top Keywords by Volume
Top Keywords by Volume metric shows the most searched for keywords related to a website or topic, ranked by search volume. It helps identify popular keywords and topics to target for SEO and PPC campaigns.