Uses one-click integrations:
-
 SEMrush
If you don't use SEMrush, you can pull data from any of our 130+ one-click, native integrations or from spreadsheets, databases and other APIs.
Try this dashboard for freeWhat you’ll learn from this Semrush (Position Tracking) Dashboard Template:
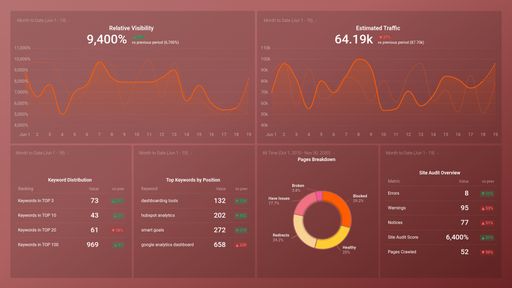
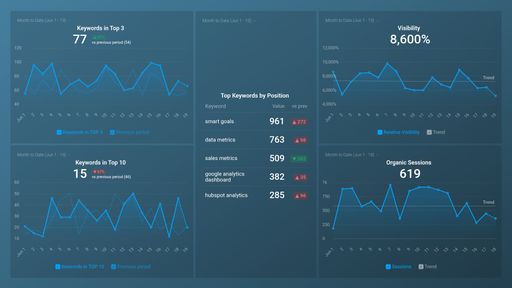
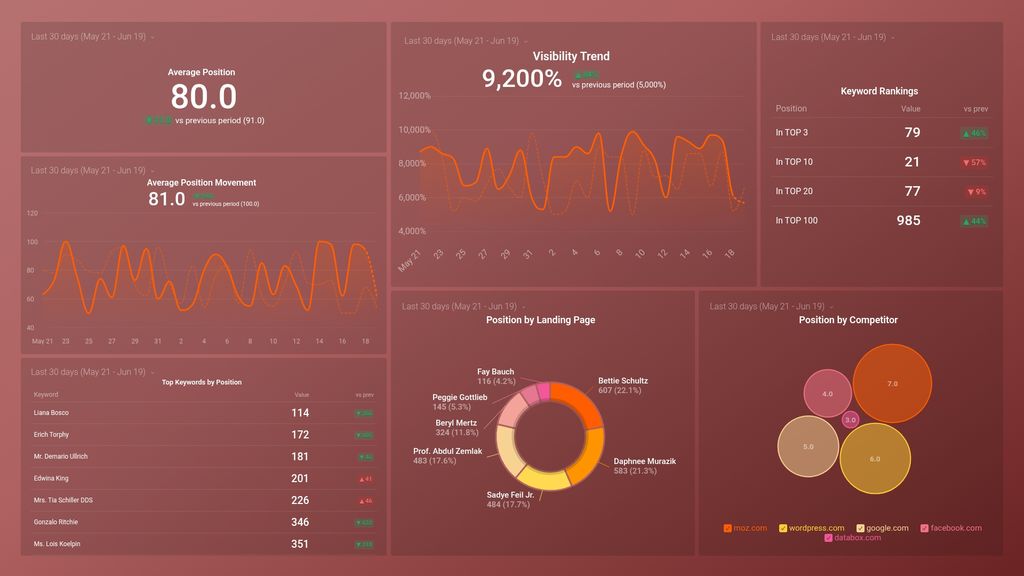
- How do I check my website’s visibility trend for specific keywords? Monitor changes in your domain, subdomain, or URL’s visibility in search engines based on specific target keywords you’re tracking. Your site’s visibility trend is measured as a percentage, i.e., between 0 and 100. The higher the rank position of your domain, subdomain or URL for its target keywords is, the higher your site’s visibility trend will be.
- How do I track my competitor’s domain visibility in search engines? Track your competitors’ domain visibility trend in Google’s organic search results for the keyword set you’re currently tracking or optimizing for in your campaign. By tracking this, you’ll be able to pinpoint when exactly major changes in the SEO Visibility of your competitor’s domains occurred and possibly why, e.g. Google updates, might result in a sudden increase or decrease in a site’s visibility trend value.
- How do I check my competitors’ average ranking position for specific keywords? Track and compare side-by-side the average ranking position of specific competitors for the set of keywords you’re currently tracking/optimizing in your campaign within a given time period.
- How do I check my rankings in Google's top 3, 10, 20, and 100 for specific keywords? Quickly view how your domain, subdomain, or URL ranks in the top 3, top 10, top 20, and top 100 positions in Google’s organic search results for your target keywords.
Pull additional data using our Semrush integration
What other campaign metrics can you track and visualize with Semrush?
- Visibility trend
- Keyword rankings
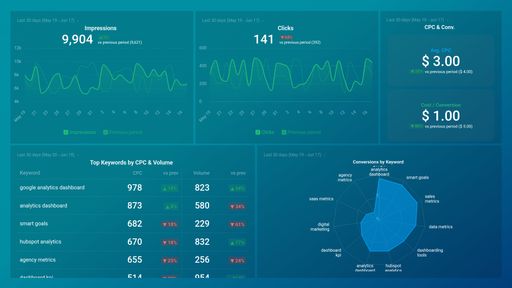
- Estimated traffic
- Rankings distribution
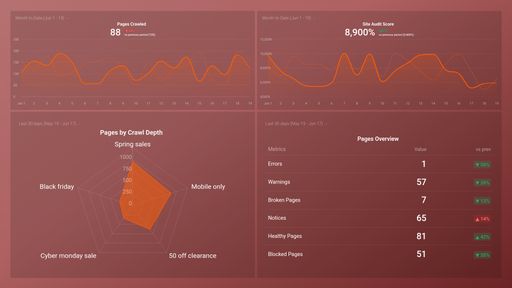
- Site errors and warnings
- Incoming internal links
- Competitor intelligence and more
There are many different metrics and metric combinations you can track using these integrations. And in Databox, you can quickly visualize dozens of Semrush metrics in a variety of different ways.
Read more about Databox’s Semrush integration.
SEMrush metrics included in this template
-
Top Keywords by Position (incl. Local, Hotel, Business Name)
Top Keywords by Position is a SEMrush metric that displays a list of keywords that a website ranks for in search results, where the website appears in the top positions. This includes local, hotel, and business name keywords. It helps to identify the website's most valuable keywords and top competitors.
-
Keywords in TOP 10
The Keywords in TOP 10 metric shows the number of organic search keywords for which a domain or URL ranks in the top 10 search results on Google. This helps to assess the search engine visibility and ranking performance of a website.
-
Keywords in TOP 100
Keywords in Top 100 is a SEMrush metric that shows the number of keywords for which a domain or URL ranks in the top 100 search engine results pages (SERPs). It helps to evaluate the domain's or URL's visibility and track SEO performance.
-
Keywords in TOP 20
Keywords in TOP 20 is a SEMrush metric that shows the number of keywords a website ranks for in the top 20 search engine results pages. It helps gauge a website's search visibility and SEO performance.
-
Keywords in TOP 3
Keywords in TOP 3 is a SEMrush metric that shows the number of keywords for which a domain or URL ranks in the top 3 search engine results pages. It indicates a site's visibility and potential traffic from high-ranking and relevant search queries.
-
Average Position by Competitor
Average position by competitor is a SEMrush metric that shows the average organic search position of your website vs. your competitors for a given set of keywords.
-
Average Position by Landing Pages
Total Average Position split up by Landing Pages. No historical data is available from before the initial connection.