Uses one-click integrations:
-
 SEMrush
If you don't use SEMrush, you can pull data from any of our 130+ one-click, native integrations or from spreadsheets, databases and other APIs.
Try this dashboard for freeWhat you’ll learn from this Semrush (Keywords and Audits) Dashboard Template:
Get a bird’s eye view of your website’s visibility in search engine results pages (SERPS). Find out how your website ranks for specific search terms. Connect your Semrush account and learn:
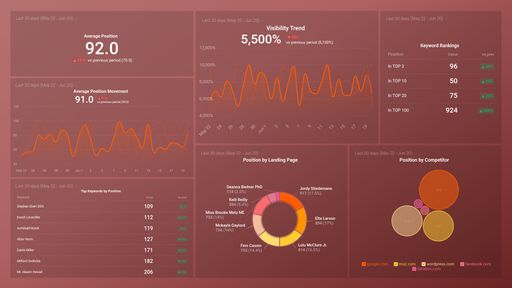
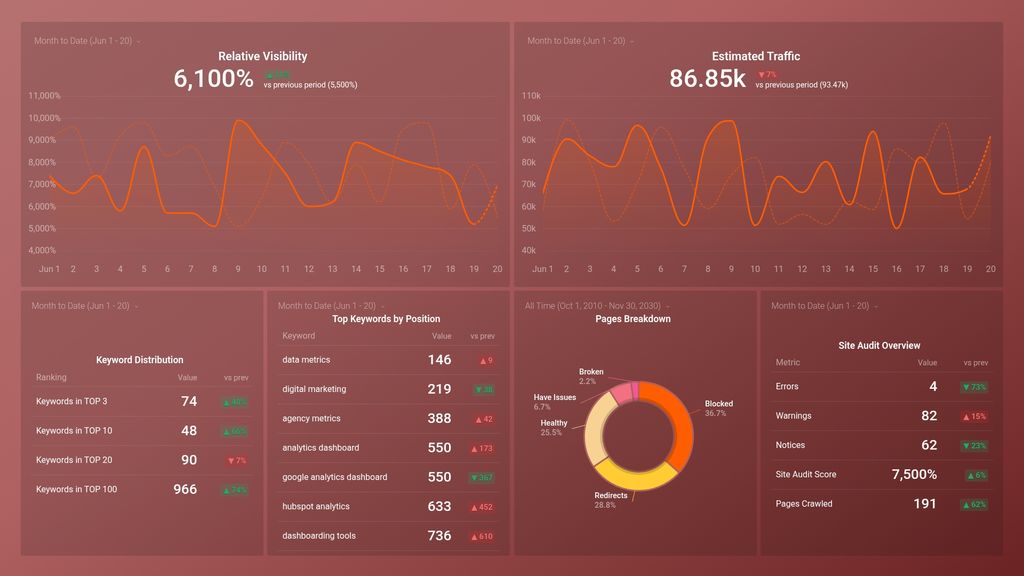
- How do I track changes and trends in my website’s rankings? Monitor your website’s visibility and ranking position for specific keywords within a given timeframe. See how your domain changes in rankings daily compared to the same prior time period.
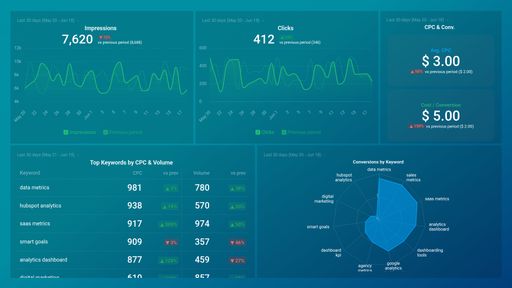
- How do I find out how much traffic my website gets? See how much of the estimated traffic is being driven to your website daily due to the current ranking positions of specific keywords.
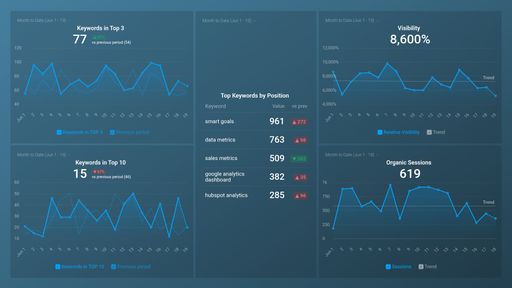
- How does my website rank in comparison to my competitors? Track and assess your website’s ranking performance in comparison to your competitors. Visually monitor your top metrics at a glance, including estimated website traffic, visibility, keywords in Google’s organic top 3, 10, 20, and 100.
- What are my top ranking keywords? Visually monitor the rankings of your target keywords on the SERP and see the amount of traffic they drive to your website during a time period.
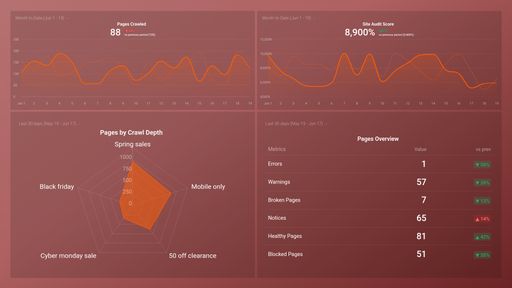
- What percentage of my site’s links are healthy? Find out the number of errors and warnings that were identified while search engines crawled your site during a performance check. Also, see what percentage of your links are healthy, blocked, broken, have issues, and so on.
- How do I assess my website's SEO health and optimization performance? Examine your website’s health and on-page SEO performance in real-time, based on your site audit score, the number of pages crawled, and the severity of issues identified on your site during a performance check.
Pull additional data using our Semrush integration
What other campaign metrics can you track and visualize with Semrush?
- Visibility trend
- Keyword rankings
- Estimated traffic
- Rankings distribution
- Site errors and warnings
- Incoming internal links
- Competitor intelligence, and more
There are many different metrics and metric combinations you can track using these integrations. And in Databox, you can quickly visualize dozens of Semrush metrics in a variety of different ways.
Read more about Databox’s Semrush integration.
SEMrush metrics included in this template
-
Errors
The Errors metric in SEMrush shows the number of technical website issues detected during a site audit. These errors can negatively affect site performance and should be fixed to improve overall SEO health.
-
Notices
The Notices metric in SEMrush is a count of the number of website issues detected by SEMrush Site Audit tool that require attention but are not as critical as errors or warnings.
-
Warnings
The Warnings metric in SEMrush indicates potential issues with a website's SEO performance, including technical errors, security issues, and other factors that could harm the site's rankings.