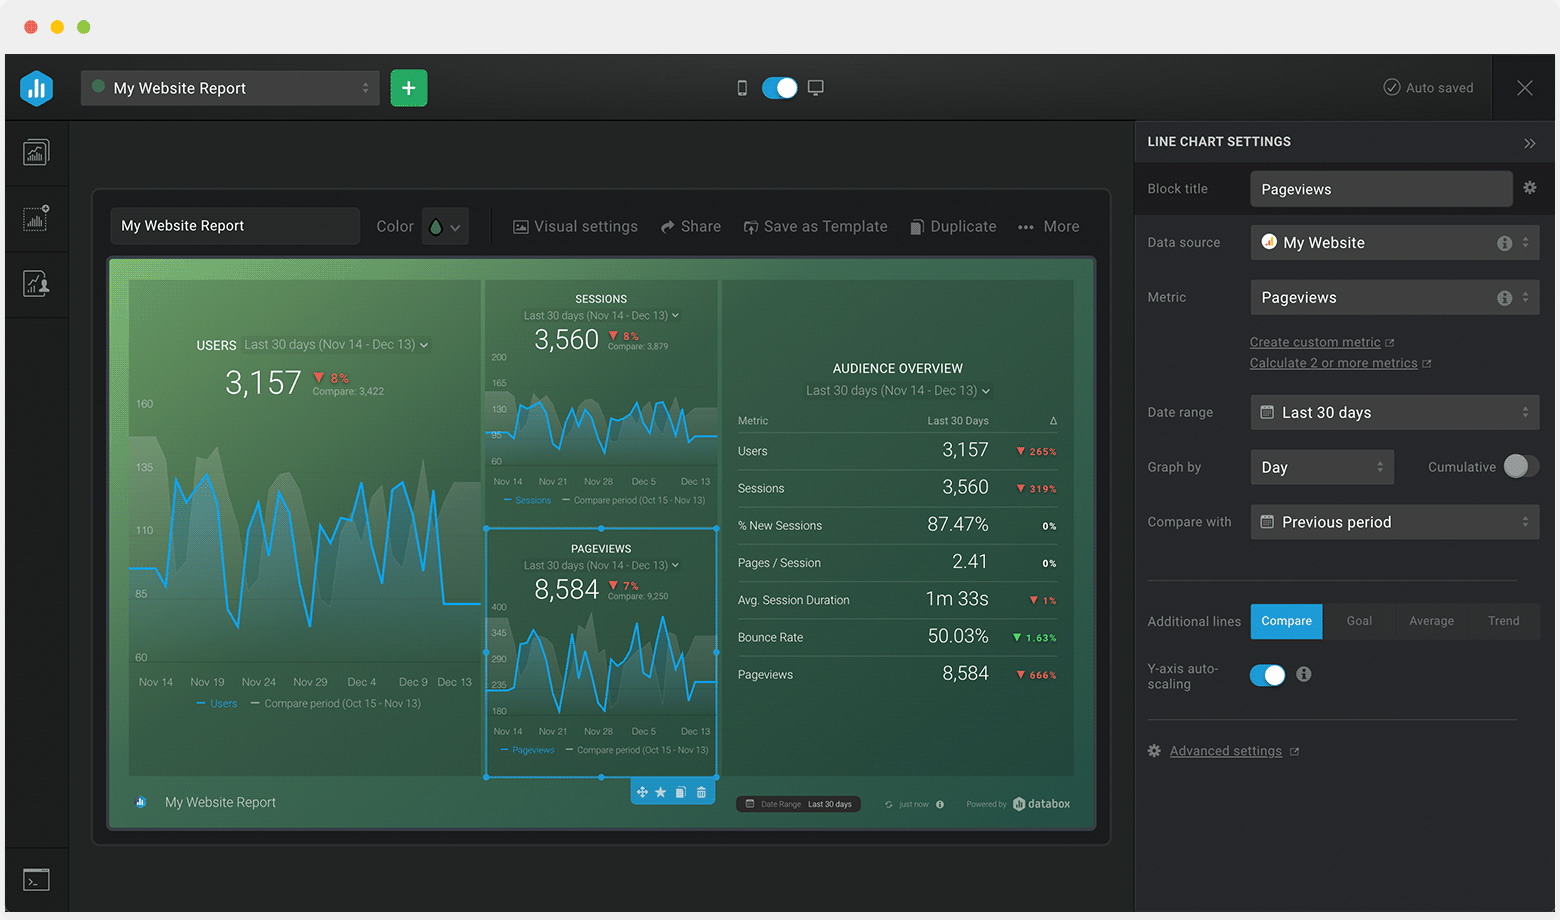
Top of Funnel Website Performance Dashboard Template

Template created by Spitfire Inbound Spitfire Inbound
Use this free, customizable Top of Funnel Website Performance Dashboard Template to gain valuable insight and complete visibility into user acquisition and behavior on your website, based on data pulled from Google Analytics and HubSpot.

Uses one-click integrations:

  • HubSpot Marketing HubSpot Marketing
  • Google Universal Analytics Google Universal Analytics

If you don’t use HubSpot Marketing or Google Universal Analytics, you can pull data from any of our 100+ one-click, native integrations or from spreadsheets, databases and other APIs.

Get this dashboard for free

What you’ll learn from this Top of Funnel Website Performance Dashboard Template:

By connecting your Google Analytics and HubSpot accounts, you’ll learn:

  • What pages on your site received the most page views last month? See your most popular pages based on the number of page views they received within a specified period of time. This information lets you know what your website visitors are most interested in, as well as your best ranking webpages in organic search.
  • What is the average amount of time users spend on specific webpages? Discover your top-performing webpages based on your website visitor’s average amount of time spent on these pages. Also, view the number of sessions recorded every time these specific pages were viewed at least once./li>
  • How do I track new and returning visitors to my website? See how many people visited your website within a specific time period. Find out how many of these users are first-time visitors and how many of them previously visited your website and have now returned.
  • How do I measure my site’s bounce rate? See what percentage of your site visitors left after viewing just a single page and without taking any action.
  • What device type do most of my site visitors use? See what percentage of users access your website using specific device types (laptop, desktop, tablet, and smartphones). Also, view the amount of website traffic each device type generates. This data is a great way to learn how your users prefer to access your website in order to further optimize their experience and make the most of your ad budget.
  • Where do my site visitors come from? Find out which traffic sources (organic search, direct traffic, referrals, social media, and so on) drive the most sessions to your site within the specified date range. Learn which traffic sources are underperforming, and dig deeper to find out why.
  • How do I access key information about my site visitors? Get a quick snapshot of who is visiting your website (new and returning visitors), the total number of visits recorded within a given timeframe, the total number of referrals, and so on.

Pull additional data using our deep integration with Google Analytics.

What else can you track and visualize with our deep integration with Google Analytics? When it comes to attributing your traffic and conversions, almost anything:

  • Website traffic and conversions
  • Traffic and lead demographics
  • Social media engagement
  • Paid advertising
  • Landing page performance
  • Campaign performance using custom events

There are many, many different metrics and metric combinations you can track using Google Analytics. And in Databox, you can quickly visualize 100s of Google Analytics metrics in a variety of different ways.

Read more about Databox’s Google Analytics integration.


Pull additional data using our deep integration with HubSpot Marketing

What else can you track and visualize with our deep integration with HubSpot Marketing? When it comes to traffic and conversions, almost anything:

  • Website traffic and conversions
  • Traffic and lead demographics
  • The conversion rate(s) throughout your marketing and sales funnel(s)
  • Paid advertising
  • Landing page performance
  • Campaign performance using custom events

There are many, many different metrics and metric combinations you can track using HubSpot Marketing. With Databox, you can quickly visualize 100s of HubSpot metrics in various ways, alongside all the important metrics from other data sources you’re using.

Read more about Databox’s HubSpot Marketing integration.

HubSpot Marketing HubSpot Marketing metrics included in this template
  • Referrers

    Total number of Refered Links pointing to the Site (inbound Links). No historical data is available from before the initial connection.

Google Universal Analytics Google Universal Analytics metrics included in this template
  • Unique Pageviews by Page

  • Avg. Time on Page by Page

  • New vs Returning Users

  • % New Sessions

    The Perctentage of the Sessions that are created by New Users (first-time visits) during specified Date Range.

  • Pages / Session

    Average Number of Pages Viewed during a Session during specified Date Range. Repeated Views of a Single Page are counted.

  • Sessions by Geo Location

    Number of Sessions during the specified date range split up by Geo Location.

Customize dashboard
Explore all of Databox’s functionalities:

Customize this dashboard with Databox

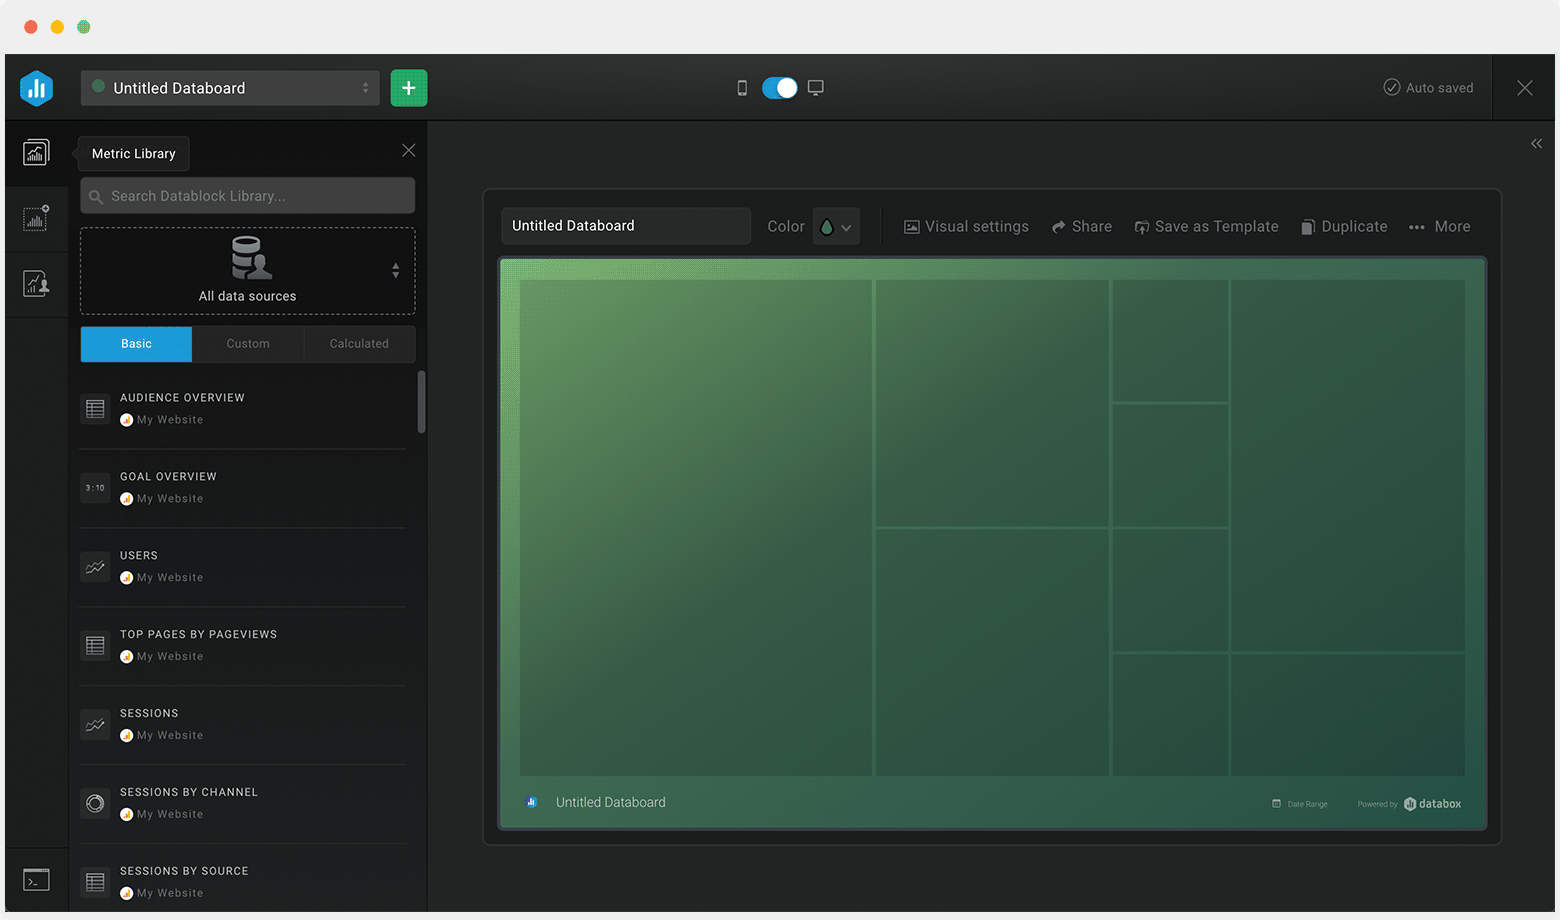
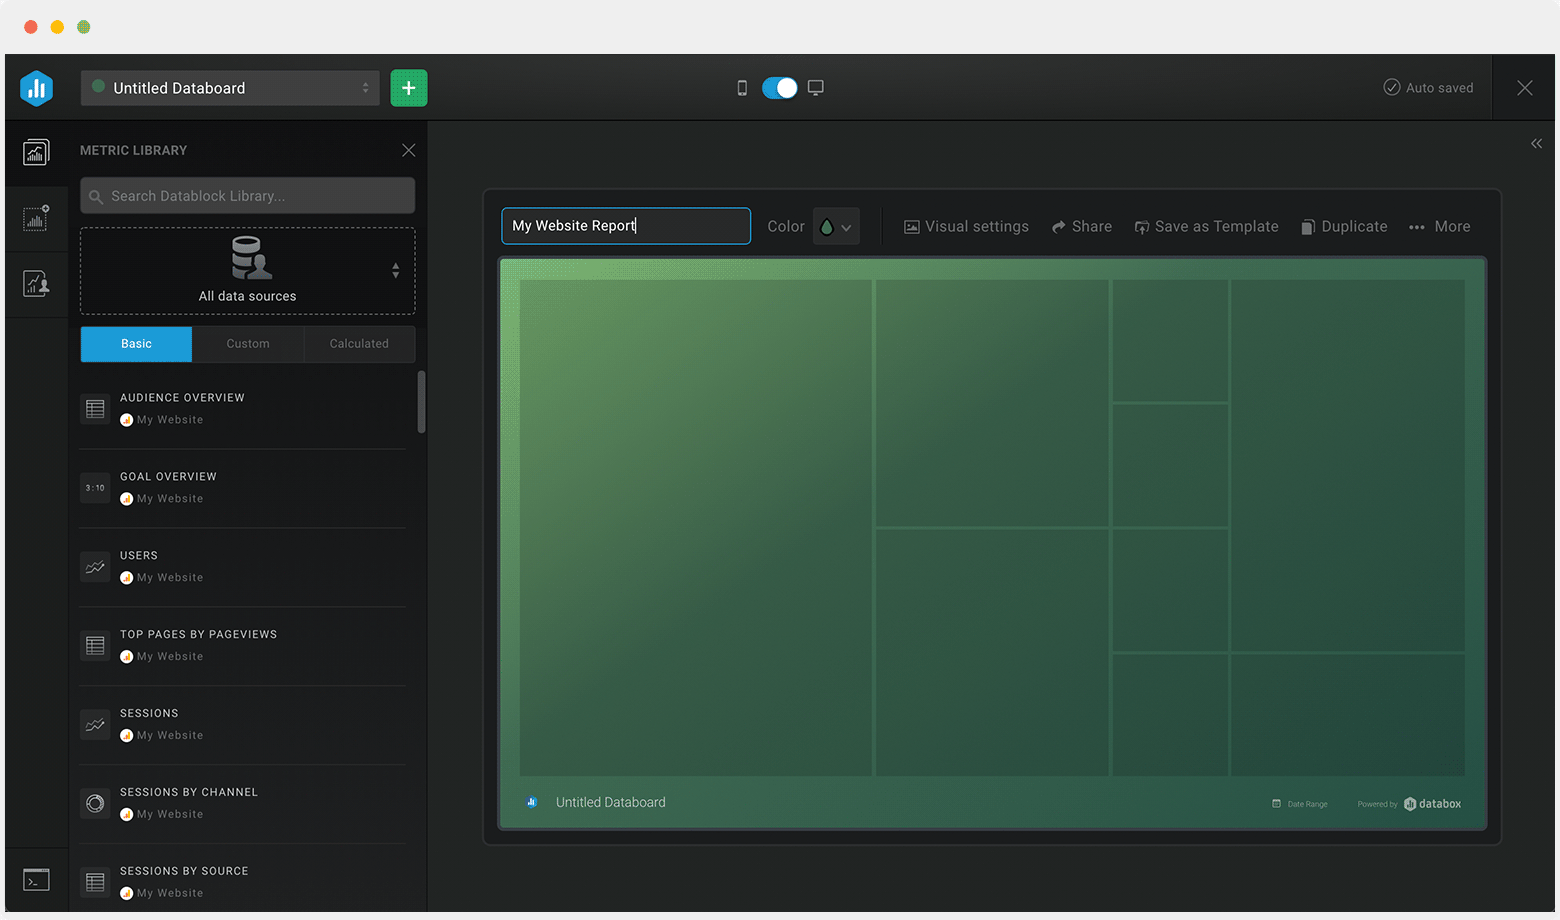
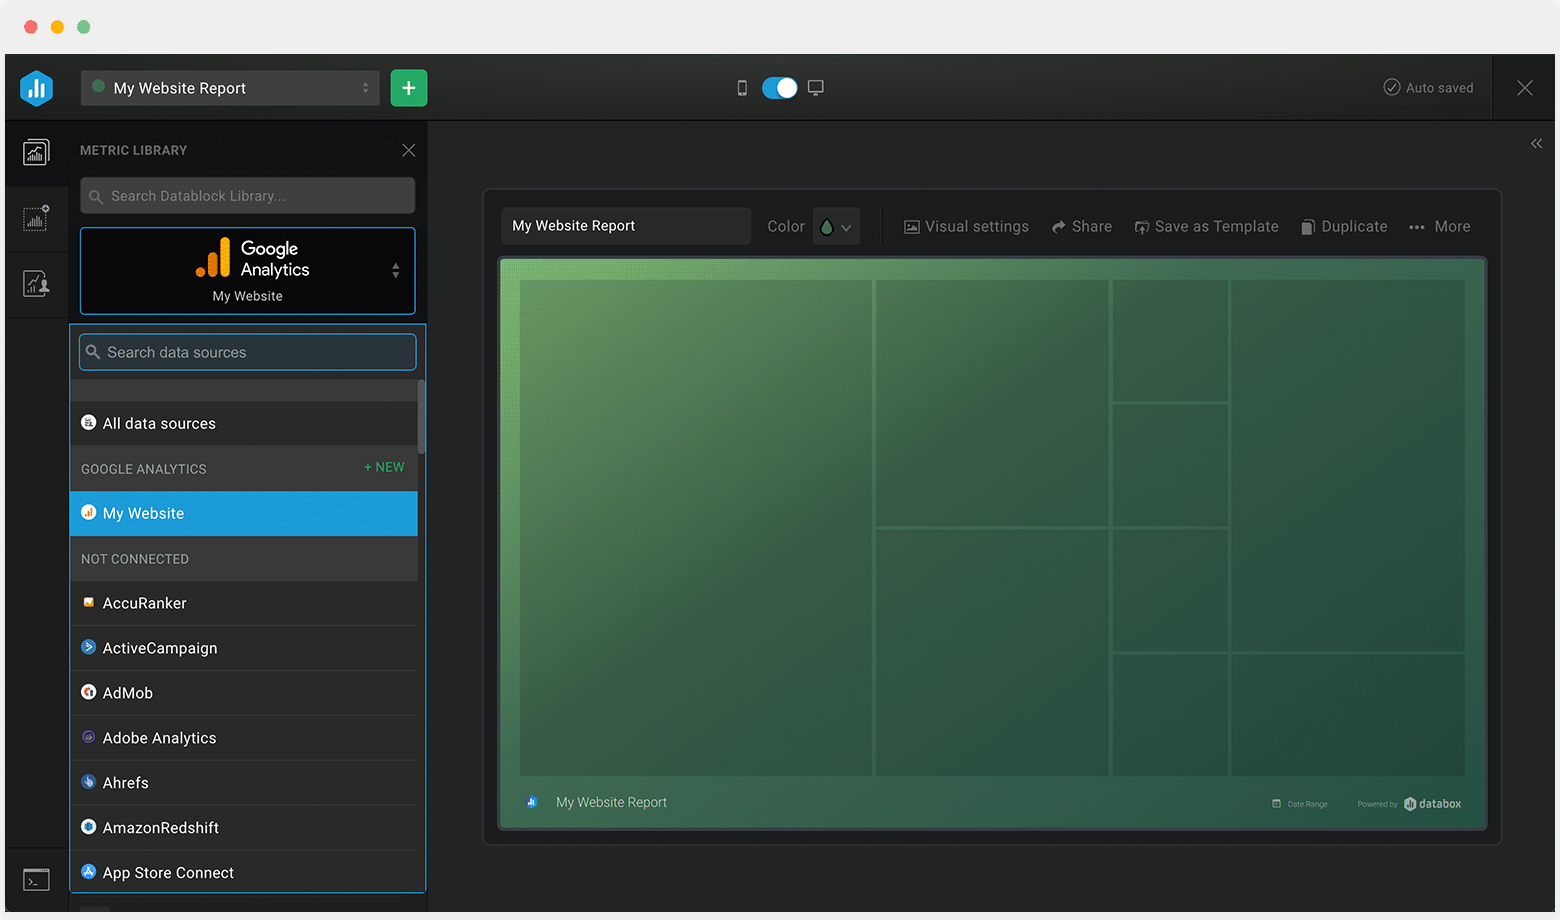
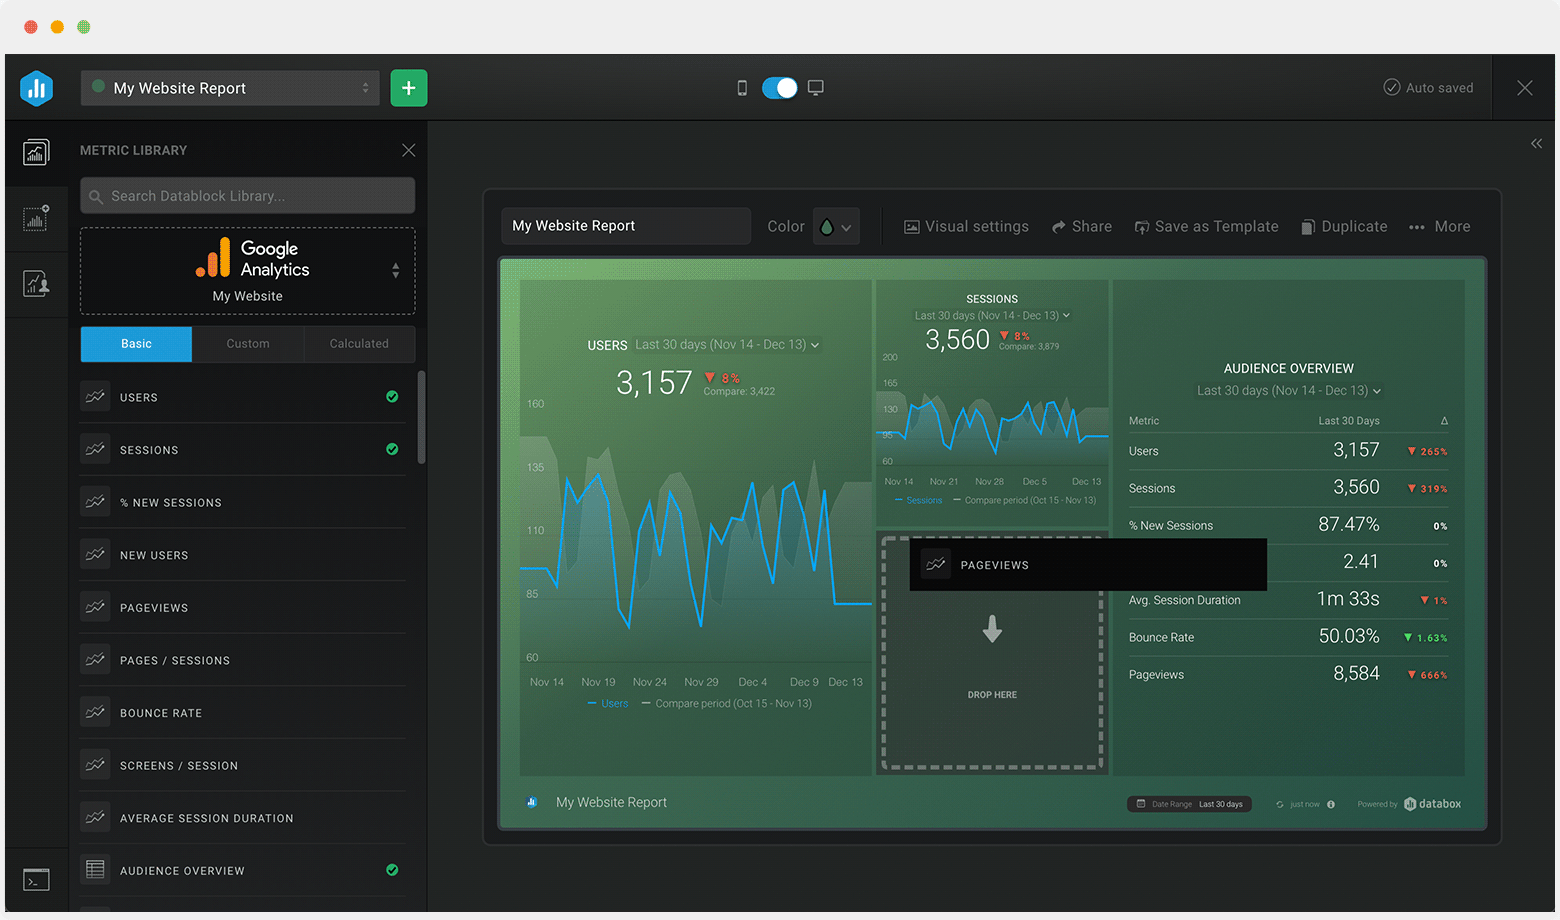
Sometimes, you’ll want to dive deeper into performance. When you need to customize this template (or any other dashboard) to include different metrics, add metrics from different sources, etc., you can do so by using Databox’s Dashboard Designer.

The Designer allows you to easily drag-and-drop metrics and visualizations from any data source right into your dashboard.

Get Started