Table of contents
According to BuiltWith, a website that tracks how software is used on websites across the internet, 29.1 million websites are using Google Analytics at the moment.
In other words, Google Analytics is used by more than 56% of websites all over the world.
Google Analytics reporting has been a practice of website owners and marketers for close to 2 decades.
So, does still hold up amidst so much competition in the market?
Yes. After all, it is Google.
But, what you get out of it is dependent on how well you have it set up. In this article, we’re going to cover some of the basics for Google Analytics reporting, including:
- What is Google Analytics?
- How to Set Up Google Analytics
- Google Analytics Hierarchy
- Google Analytics Dimensions and Metrics
- How to Use Google Analytics
- What Are Google Analytics Reports?
- How to Set up a Google Analytics Custom Dashboard?
- Alternatives to Google Analytics

What is Google Analytics?
Google Analytics is an analytics tool that allows you to measure the performance of your website.
If that sounds simple, it is.
If it sounds basic, it’s not.
Google Analytics allows you to measure broad metrics like Sessions, but its brilliance is in its ability to dig deeper into engagement metrics like bounce rate, average time on page, exit rate, etc., to help you understand how people engage with your website and content.
Further, you can create custom goals to track things like signups, purchases, and more, to get a holistic view of your entire funnel. More on that later.
Related: 12 Confusing Google Analytics Terms That Marketers Need to Know
But, what can Google Analytics actually do for you?
What Does Google Analytics Do?
Google Analytics shows you valuable data related to your visitors, third party tools, and your website, but we all know that there is so much more to the story.
Google Analytics’ main functions can be broken down into four essential categories:
Data collection and management
Everything starts with data collection. If there is a mistake made here, all the steps that follow will be worthless. Data collection helps you understand how your customers behave online. It lets you assemble the most useful information, and afterward easily share it with your team.
Data consolidation
Data consolidation provides you with a more complete picture as it gets data from different sources and combines it. This results in a more comprehensive view of your audience and their behavior.
Data analytics and reporting
Data analytics and reporting allow you to filter customer information with the goal of better understanding which content is doing better and which is seemingly irrelevant. It can help you have a clear vision of what has the most significant effect on your content performance.
Data activation
Data activation is you simply using the data Google Analytics has provided – that way, you can make more educated decisions. There are a lot of options to consider, from requesting notifications when traffic shifts to deploying A/B tests and tracking engagements.
Now that we have gotten to know GA a bit better, it is time to pose the following question – why should you use Google Analytics?
Why Should You Use Google Analytics?
Simply put, because it helps you understand how your website is performing and engaging your audience.
At a high level, Google Analytics allows you to track and understand your customer’s behavior, what they’re looking for, and whether your business is addressing their needs.
The information provided is essential for running a successful business. For a more complete answer, the following might prove useful:
The Pros and Cons of Google Analytics
Now, before we get started, it is important to stress that the pros and cons are not universal, and they depend on the individual needs of the consumer. You can see just how much they differ if you check out the TrustRadius GA reviews.
The most common pros include:
- You can use it in different digital environments, such as websites and mobile applications.
- You can connect your Google Analytics account with your Google Ads account.
- You can create custom goals and custom reports based on your needs. This way, you can track specific information depending on your industry.
On the other hand, the most common cons are:
- Lack of better training tools and resources for beginners
- With constant improvements to the UI and additions of new features, it can get really difficult to stay on top of everything happening.
- The cost to move to a premium account is significant.
How to Set Up Google Analytics
Need to add the Google Analytics tracking code to your website? Here’s how to set up Google Analytics in four simple steps.
- Step 1: Create Your Account
- Step 2: Add a Property
- Step 3: Set Up a Reporting View
- Step 4: Add Tracking Code to Your Website
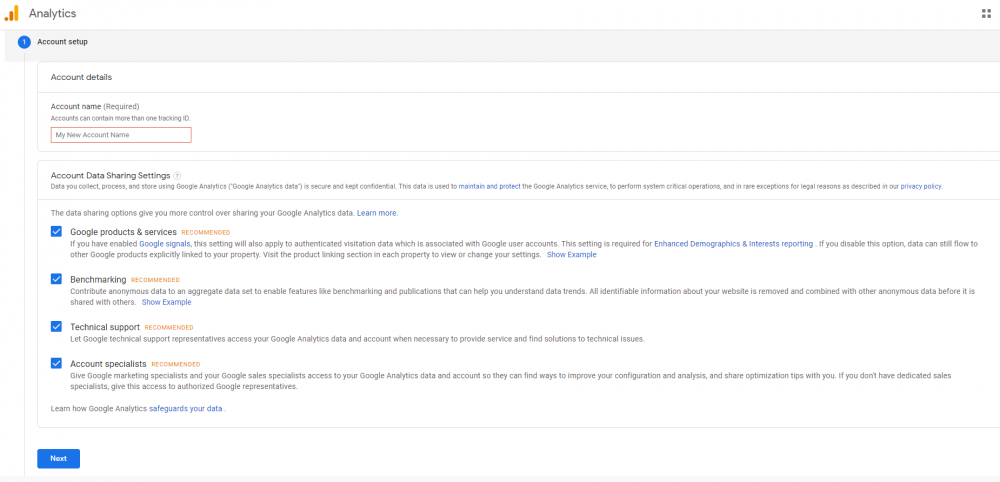
Step 1: Create Your Account
- Go to google.com/analytics
- Here you can create an account by clicking Start for free or sign in to your account by clicking Sign in to Analytics.
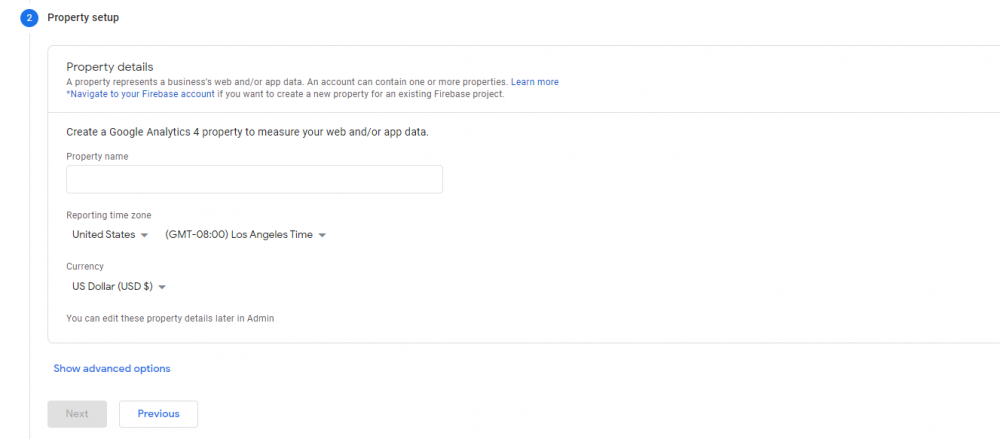
Step 2: Add A New Property to Your Account
A property is the collection point in Google Analytics for the data from your website or app.
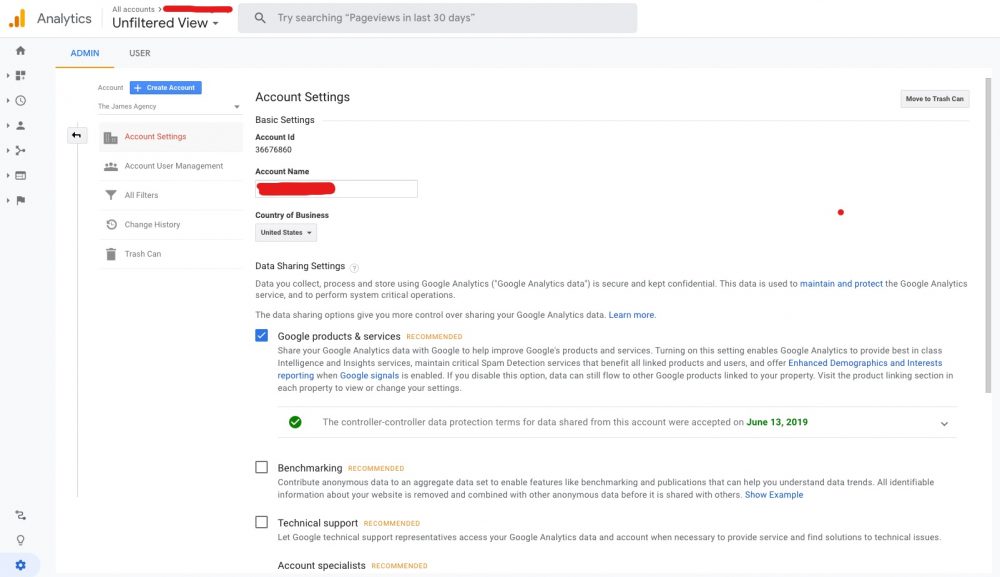
Step 3: Set Up a Reporting View
A reporting view is a level in a Google Analytics account where you can access reports and analysis tools.
Google Analytics automatically creates one unfiltered view for every property in your account. It is important to remember that, at this point, you can set up multiple views on a single property.
Step 4: Add the Google Analytics Tracking Code to Your Website
This is how you’ll begin to collect data in your Google Analytics property.
All that is left now is for you to configure your account, views, and properties to best suit your needs for specific data.
Check out Google Analytics Hierarchy for more detailed explanations on what to do next.
PRO TIP: How to track these 10 popular Google Analytics 4 metrics
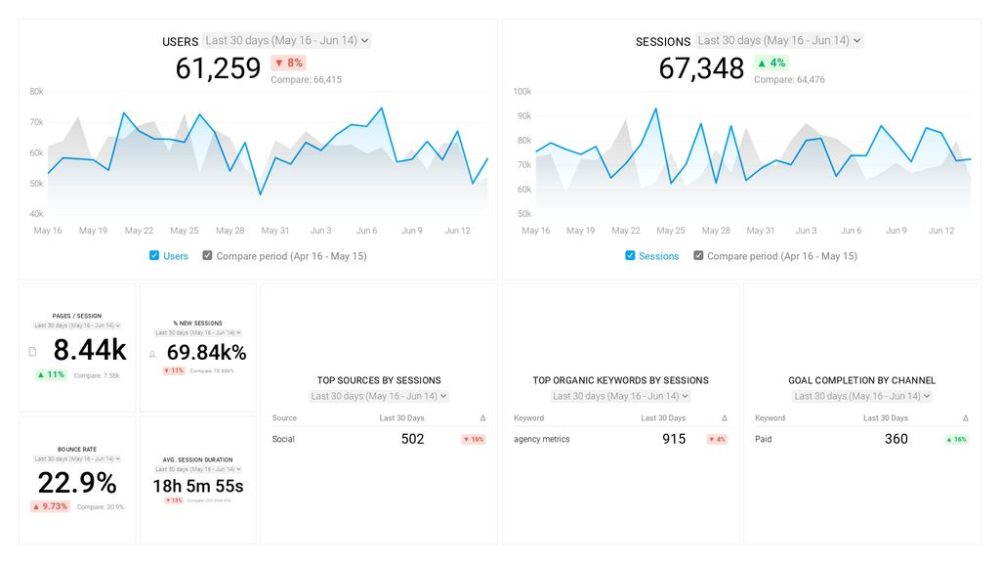
Sure, there are dozens (and dozens?) more Google Analytics 4 metrics you could track. But, starting with these 10 commonly tracked metrics will give you a pretty high-level view of how your marketing is working…
- Sessions: The number of sessions can tell you how many times people are returning to your website. Obviously, the higher the better.
- Sessions by organic keyword: Which organic keywords bring in the most traffic to your website? This may help you determine whether your SEO investments are paying off.
- Bounce rate: Do visitors leave shortly after landing on your website? Or do they stick around?
- Average session duration: How much time are people spending on your website? Users with a high average session duration are most likely relevant to your company.
- Goal completions: How many users responded to your call to action?
If you want to track these in Google Analytics, you might find the visualizations limiting. It’s also a bit time-consuming to combine all the metrics you need in one view.
To better understand how your website performs in terms of traffic growth and conversions, we’ve made this plug-and-play dashboard that contains all the essential metrics for understanding how successful you are at optimizing different aspects of your website.
You can easily set it up in just a few clicks – no coding required.
To set up the dashboard, follow these 3 simple steps:
Step 1: Get the template
Step 2: Connect your Google Analytics account with Databox.
Step 3: Watch your dashboard populate in seconds.
Google Analytics Hierarchy
After you start tracking data from your website, you will want to only collect what is relevant.
So you will probably need to set some filters and this is where setting up Google Analytics Hierarchy comes into play.
Now, we will cover each separate item within the Google Analytics hierarchy.
Organization
As you can see from the graph above, the organization is at the highest level. It represents your company, and it enables you to access your company’s product accounts (e.g., Analytics, Tag Manager, Optimize), and manage product users, permissions, and cross-product integrations.
Organizations are not mandatory but are recommended, especially for bigger businesses.
Account(s)
Accounts are obligatory, and using GA requires at least one account. It is your access point for Analytics. One or more Analytics accounts can belong to a single organization. You use your account to manage your properties – you can assign one property to each account or multiple properties to one account. Keep in mind that one account can hold up to 50 properties.
Property
A property can be a website, mobile application, blog, etc. Within an Analytics account, you add the properties from which you want to collect data. Once you have added a property to an account, Analytics generates the tracking code that you use to collect data from that property. A property can contain one or more views.
View
A view is your access point for reports. The minimum number of views per property is two.
To clarify, when you add a property to an account, Analytics creates the first view for that property. The created view has no filters, and that means that it contains all the data for that property. It is best to leave that view so that you can always have access to all the data. Then you can go on and generate additional views that contain the filters you need to get the precise data you require.
Users and permissions
This is an important segment allowing you to know who can access your GA. You can add users at the account, property, or view level. More importantly, you can restrict their access at each level.
When you add a user, you identify that person by an email address that is registered in Google accounts. You can assign the appropriate permissions to each user.
So, if it is a member of your team, you can have them perform administrative tasks like creating additional views and filters. Or, in case you have clients whose website you are managing, you can ensure that they have access to reporting data.
Google Analytics Dimensions and Metrics
Google Analytics comes equipped with more than 200 standard metrics that you can use to track the performance of your website.
Not sure where to get started? Here are the most popular Google Analytics metrics according to our research.
Metrics are simply a unit of measurement for a specific action on your website. A new visitor. A pageview. An exit. In Google Analytics, metrics are expressed in number values, percentages, money, or time as they are quantitative measurements of data.
In Google Analytics, you can use dimensions to manipulate metrics further in order to gain more specific insights. Dimensions in Google Analytics allow you to parse a metric by specific criteria, like page, country, device, etc.
So, instead of only tracking Sessions, you can use dimensions to track Sessions by Device, Sessions by Country, etc., to get a better understanding of the makeup of your website visitors.
There are 2 types of Google Analytics dimensions:
- Default dimensions – ones that are already available in GA reports. These include browser, operating system, KW, source/medium gender, age, city, etc.
- Custom Dimensions – ones that are custom-defined by users.
Keep in mind that both default and custom GA dimensions can be used as both primary and secondary dimensions in GA reporting.
Deciding which metrics you need to be focusing on depends on your company’s SMART marketing goals related to your digital presence. Different goals ask for different tactics and result in tracking different metrics.
Metrics relevant to your website’s success include the following:
- Number of visitors – with these metrics you will be able to determine how many new users you are getting versus returning users. These numbers can show you the effectiveness of different marketing efforts or changes that you perform on your website.
- Conversion rate – helps you track the number of completed user activities or purchases on your website. The calculation for it is simple – the number of goal conversions divided by the number of sessions, times 100
- Avg. page depth– this metric indicates the average number of pages visited by a user within a session. It helps you understand user behavior better thus guiding your site optimization efforts.
- When it comes to tracking the success of your content it would be wise to include these two:
- Avg. session duration – the length of time people stay on your site is the real measure of content you are providing.
- Behavior flow – shows you how people are going through your site. It is your content that should be guiding them.
If your goal is achieving better email marketing campaigns some of the Google Analytics metrics to focus on should be these:
- Number of sessions from emails – it shows you the actual contribution email makes to overall sessions. And it also includes a trend line that indicates how visits from email have changed over time.
- Number of unique visitors from emails – it shows you just how many users have come to your website from your email marketing campaigns.
- When it comes to your company’s SEO efforts, again specific metrics come into play:
- Organic traffic – this metric shows the traffic you earn from showing up in SERPs without paying for placement.
- Organic Search – this metric helps you when determining ROI on your SEO efforts. There is a lot that goes into actually seeing a clear return on investment through sheer numbers, but this particular metric is a good start.
- Organic click-through rate – this metric shows the proportion of clicks in relation to the impressions in the SERP. It is a valuable insight. Certainly, it depends on your ranking, but it can also serve as an indicator regarding which pages need improved onsite-SEO. This can include changes in the URL, meta tag descriptions, and title tags.
And lastly, here are just some of the most common engagement metrics for measuring your top-of-funnel engagement:
- Sessions: Measure the volume of visits to your website.
- Users: Measures unique visitors to your website.
- Pageviews: Measure the total number of pages viewed on your website.
- Average time on page: Measures the amount of time (on average) users spend on your website.
- Bounce rate: Measures the percentage of sessions that leave your website without taking any additional action.
Related: Sessions vs. Users vs. Pageviews in Google Analytics: Everything You Need to Know
Custom Dimensions and Metrics
It is important to remember that custom dimensions and custom metrics are like default dimensions and metrics in your GA account, the only difference is that you create them yourself according to your particular needs.
In addition, they can appear as primary dimensions in your custom Google Analytics report or as segments and secondary dimensions in standard reports.
Let’s try to understand this better through an example – so, for example, if you want to understand how audience engagement impacts other metrics, such as conversions or pages per session, there is a simple solution. All you need to do is create three custom dimensions for each type of reader that you have:
- Advocate – this would be a user who shared one-plus posts on social media
- Subscriber – this would be a user who signed up for your email list
- Customer – this would be a user who purchased premium access
The information you obtain by using these dimensions is bound to prove extremely useful in deciding which steps to take next.
What’s a Google Analytics segment?
A segment is a subset of your Google Analytics data. It helps you extract deeper insights from the data you’ve collected. And this is quite relevant since if you are only viewing standard reports, checking your monthly visitor count or your daily revenue, you are not tapping into most of what Google Analytics has to offer.
It is important to note that Google Analytics segments allow you to isolate and analyze specific subsets of data so you can examine and respond to the component trends in your business. Now, a segment is made up of one or more non-destructive filters that isolate subsets of users, sessions, and hits.
- Users – are people who interact with your website or app.
- Sessions – are grouped interactions by a single user.
- Hits – are interactions during a session, like pageviews, events, and transactions.
We will go back to considering the GA hierarchy for just a moment, as it is important to note that a single user can have multiple sessions, and each session can have multiple hits.
How to Use Google Analytics
Once you have set up your account and put in place all the relevant dimensions and metrics, it is time to start tracking. Based on the data you extract you can adjust your website, content, and marketing direction.
After every change you get to continue the monitoring process and see whether the metrics that are relevant to you have shifted towards the desired goal. Just be patient, each change takes time to provide a result.
What Are Google Analytics Reports?
There are 7 different types of Google Analytics reports you can build in your account.
It is important to have a general understanding of the options you have beforehand so that you can make the best possible choice for your property.
But first, let’s go over the basic features –
- Left Sidebar – this is where you will find all the different sets of data and reports to run.
- Date range – here you can set the date range of the data you are looking at; this is especially important if you want to see whether changes you have made were fruitful.
- Email – this allows you to email the report you have to anyone you choose.
- Export – is where you can export the data you are looking at.
- Segments – this is used to compare different sets of data. The default is “All Users” and you have the option of choosing up to four segments to compare.
Now, it is time to get acquainted with different Google Analytics report types.
- Real-Time Report
- Audience Report
- Analytics Acquisition Reports
- Content Report
- Site Speed Report
- Site Search
- Conversion Reports
Real-Time Report
The Real-Time report in Google Analytics provides you with the option to monitor activity on your website as it occurs from moment-to-moment. This is relevant for obtaining insights on how people are reacting to your marketing campaigns, app, or website infrastructure, or any changes you have made.
The reports are updated continuously, and each website session is reported seconds after it occurs.
Audience Report
The audience report in Google Analytics provides insight into the characteristics of your users. You need an audience report if you need the answers to some of the following questions –
- How much website traffic do you have?
- Are they new or returning users?
- What device types do they use when visiting your website?
- What are the general demographics of your users?
Now, let’s look at some of the specific GA reports you can pull under the audience report tab –
Active users
You can track active users for increments of 1, 7, 14, and 28 days. That way you can see if their interest in your product or content is growing or falling.
Lifetime value
Lifetime value helps you understand how valuable different users are to your business based on lifetime performance across multiple sessions. If you track users acquired through different marketing channels you can see which ones are more profitable and thus allocate your efforts to them.
Cohort Analysis
First, let’s define cohort – a cohort is a group of users who share a common characteristic that is identified in the report by an Analytics dimension. The main benefit of the Cohort Analysis report is that it enables you to isolate and analyze cohort behavior.
Analytics Acquisition Reports
The Acquisition reports in Google Analytics tell you where your users originated from, such as search engines, social networks, or website referrals. The Acquisitions overview report will show you how well each channel drives conversions thus playing a pivotal role when it comes to formulating your marketing campaigns.
Here are some of the main channels Google Analytics uses to track your traffic sources –
- Organic Search – users who find your website through search engines.
- Paid Search – users who come to your website from paid search ads.
- Direct – users who come to your website without a traceable referral source.
- Referral – users who come to your website from another website via a link.
- Social – users brought to your website via a social network.
- Other – GA uses this category when it doesn’t know how to categorize a subset of traffic.
Related: The Only Google Analytics Acquisition Dashboard You’ll Ever Need [Data Snacks]
Content Report
Content reports in Google Analytics provide you with a review of all of the blog posts, landing pages, and web pages on your site.
All Pages Report
An All Pages report gives you the engagement metrics for each page on your site. You can see the top-trafficked pages for your current view and/or segment. That way you can track what are your most visited URLs in the selected time period.
Content Drilldown Report
This report breaks down the structure of your site by subdomain and then subfolder. It shows you the engagement metrics for directories and pages on your site. You can drill into directories to see subdirectories and individual pages. The value of this report is most prominent if you need to manage more complex properties.
Related: 7 Ways to Use Content Groupings in Google Analytics to Better Understand Your Site’s Content
Landing Page Report
This report enables you to see whether your landing pages are engaging users and contributing to conversions in the way you expect them to. According to industry experts landing page reports provide knowledge as to what content should be produced going forward because they enable focusing on the organic landing pages that are actually driving value to the business rather than just viewing site-wide conversion reports.
Exit Page Report
As the name says this report shows the last pages users visited in their sessions before they left your site. Ideally, it should not be the same as the first. From this report, you can see whether your user journey is successful and if your users end up on the desired exit page, which for most businesses is the checkout page.
Related: 12 Tips for Creating a Content Marketing Dashboard in Google Analytics
Site Speed Report
Site speed is an important factor in user experience as you want to ensure your users are able to load your website on their devices within a reasonable timeframe. 53% of people surveyed by Google say they will leave a website if it takes longer than three seconds to load. The average time web-wide, however, is around twenty-two seconds, just so you can have a clear idea as to where your site ranks.
Site Speed Page Timings Report
This report lets you perform a detailed analysis of individual page performance. It can help you identify which pages have the slowest loading time so that you can take steps to improve them. The report includes the following tabs –
- Explorer – provides page data in the context of different primary and secondary dimensions. It includes the following metrics – site usage, technical and DOM timings.
- Distribution – provides timing buckets for different metrics.
- Map Overlay – provides geographic data in the context of different primary and secondary dimensions. It includes the following metrics – site usage, technical and DOM timings.
Site Search
A site search is a functionality provided by a website in the form of a search box that users can use to find information or products on your website. So, if you have a site search you should make sure that you have set up ‘site search tracking’ in Google Analytics.
Now we can move on to the reports.
Usage Report
A usage report provides you with the number of sessions that have occurred with and without one-plus searches. It provides the site search usage frequency for the view and time period that you have previously specified.
Search Terms
This report provides you with insights into what users are searching for on your website. If the same search terms keep reappearing, you might want to make sure that you provide the people visiting your site with the content they need. Or if you already have it, take steps to make it more visible for the site users.
Make sure that you also check the “% Search Exits” column. The information in it provides you with the number of users who have clicked away from the search results page rather than choosing a result. This usually means that they have not located what they were looking for.
Search Pages
This shows you on which pages the users start their searches. It usually means that they have not found what they need on that particular page.
If it is a broken page it can be easily fixed. However, if it is a product page, you will need to go over the content you provide so as to make sure it answers the question posed in the search box.
Events
Let’s start with an explanation of what Google Analytics defines as events – these are user interactions with content that can be measured independently from a web page or a screen load. Still not quite clear? It is ok, we’ll put it this way, everything from Downloads and link clicks to form submissions and video plays is viewed by GA as events.
Tracking events can provide you with very valuable information – for example, if your new video is not getting the number of plays you predicted, you can take steps needed to improve on that and then recheck with events to see if you were successful.
Conversion Reports
The calculations are clear, marketing traffic is not valuable until it translates to real conversions. Now, depending on your business, your much-needed conversions fall under either a sale or a lead.
There are several ways to track your conversions in GA –
- Goals – goal reports provide you with a summary of all your goals.
- Ecommerce – you can get a summary and deep-dive into your product inventory sales and checkout flow.
- Multi-Channel Funnels – in this case, conversions count is viewed based on different channel attribution models i.e. first touch, last touch, and other models.
- In this case, we are going to focus on goal conversion reports. But first a short definition – a goal is essentially a conversion that you’ve defined.
- Before we get to reporting it is essential that you choose how you want to define your goal –
- Destination – this goal is reached when a user reaches a specific page
- Duration – this goal is reached when a user session is longer than the pre-set time
- Event – this goal is reached when a specified interaction occurs under Event parameters
- Smart Goals – Google Ads automatically defines common behaviors on your site and sets them as goals
Now, let’s take a look at the conversion reports:
Related: The 14 Most Important Conversion Metrics to Track Using Google Analytics
Goals Overview
The Goals Overview report presents metrics that help you track your conversions fairly quickly. When checking this report pay attention to the following – Goal Completions, Goal Value, Goal Conversion Rate, and Abandonment Rate. Depending on which of these metrics is failing you can determine what steps need to be taken to reverse the process.
Goal URLs
The Goal URLs report breaks down conversions by “Goal Completion URL” – this means that you know exactly where the conversion happened, on which page. Keep in mind that the URL structure needs to be unique for each destination, so you can identify the most popular pages or products more accurately.
Funnel Visualization
Funnel Visualization reports are relevant when you have a specific flow that you push your users through. It shows you the following –
- The number of people who reached each step in order
- Pages that led to the first step
- At what step and what page did users proceed to the next step
That way you can identify at which stages you are losing users and if it is, say, right at the start or all the way at the checkout. Now if you don’t want as strict of a process as Funnel Visualization you can decide on a Goal Flow.
Goal Flow
A Goal Flow report can illuminate your sales funnel and improve your customer experience. Setting a goal/funnel allows for Goal Flow reporting since you must have at least one goal established before you can obtain Goal Flow data.
Unlike the Funnel Visualization report, Goal Flow offers a far more flexible funnel reporting system that allows for historical data analysis, advanced segmentation, and funnel analysis without backfilling.
How to Set up a Google Analytics Custom Dashboard?
Sometimes the default Google Analytics dashboards aren’t enough––so, knowing how to create custom dashboards in Google Analytics is important for building personalized views of your performance. Whether it’s a content marketing reporting dashboard or an ecommerce one, customization is key.
To set up a custom Google Analytics dashboard you need to do the following:
- Start by logging into your Google Analytics account.
- Go to Customization » Dashboards and click on the red Create button.
- A popup will appear giving you two choices – Blank Canvas (a template with no widgets in it) and Starter Dashboard (a template with a default set of starter widgets)
- After you pick a template and name your dashboard you can click “Create Dashboard”
For a truly custom dashboard, the best template is Blank Canvas, as you will get a popup for adding widgets to your dashboard and you can choose the ones that are most relevant to your personal needs.
Your dashboard can have one or more of the following types of widgets: metric, timeline, geomap, table, pie, or bar.
For some, even a customized Google Analytics Dashboard might be confusing or it might lack certain elements. That is precisely why having options is a good thing.
Bonus: Did you know that any Databox dashboard can be displayed on your smart TV? Broadcast your TV Dashboards for free now.
Alternatives to Google Analytics
Databox. The answer is Databox. (lol)
Obviously, there are many alternatives to using Google Analytics, however, at Databox we’ve built a Google Analytics reporting tool that not only allows you to track all of your standard and custom Google Analytics KPIs in one place, but you can also combine them with metrics from any of the other tools you’re using to run your business.
Here’s A Little More About Databox
Databox pulls all your data into one place, so you can track performance and discover insights in real-time.
Our custom dashboard software allows you to track and share KPIs from key applications, touting a no-code setup and an API and query tools for integration with custom data sources and data searches.
One additional perk is a vast selection of dashboard templates that are created by certified experts. That means that you get to use their knowledge to build comprehensive reports quickly.
Related: The Top 10 Databox Datablocks for Google Analytics
Ready to Visualize Your Google Analytics Performance?
You’re probably tracking a ton of metrics in Google Analytics.
You can visualize those metrics, alongside metrics from other tools you’re using, in one place with Databox.
And, it’s free. Just create your free account here, connect your Google Analytics account, and start tracking your website performance alongside