


Table of contents
Before you can leverage the extensive measurement capabilities within Google Analytics, you need to understand its complicated vocabulary.
Experts have estimated that Google Analytics is used on 30+ million sites.
But, even to an intermediate user, Google Analytics can be extremely confusing. Not only do you have to learn their language, some of the concepts they introduce are complicated too.
UTM Parameters, segments, filters, views, properties, metrics, dimensions — oh my!
It’s enough to make your head spin. And many more, mathematically-astute than you have given up. Most never even try. Just because it’s installed on millions of sites, that doesn’t mean it’s used well by millions of businesses.
Over the last few years, I’ve had to configure GA for a few companies. I’ve based this article on my experience.

While you’ll have to embrace Google Analytics (GA) terminology, I’ve tried to remove the mystery, so you can skip the steep learning curve I’ve had.
By the time you’re done this article, you will know how to set up your account, track the success of your website, analyze what’s working best and track and improve your marketing campaigns. Simply put, Google Analytics Reporting will become a lot easier.
Set Up Your Account Correctly
Begin by understanding how Google structures accounts, properties, and views.
An account is the top-most level of organization. You need an account to access GA in the first place. This usually represents an entire company.
Below accounts are properties. Typically, a property is a website or a mobile app. But, it could also be a point-of-sale kiosk, a web application or anything else you might want to track. Most businesses just have one property: their website. But, an account often has more than one property — such as a company with a website and an app.
A view is a subset of a property and where you setup and view reports for analysis. Views are defined presentations of specific data within individual properties. You don’t have to set up separate views and most don’t. If your use case is simple, like analyzing your website’s ability to generate leads for your sales team, you can probably just use the standard view that comes when you set up your property. However, if you’re doing extensive analysis for different purposes, you may want to create separate views, though. For example, if you’re a SaaS company, you might want one view for user acquisition and one for customer retention. Views would let you create separate, well “views” for each of these use cases.
When you add or create a property, GA will automatically create the first view — which will be totally unfiltered, where you can see all the data applied to that property. If you do create separate views, don’t edit this one. You should leave this unfiltered view so that you always have a “35,000-foot view” of your data. Here’s Google’s explanation of Views, which I find a bit confusing, but is perfectly accurate, of course.
Filters or Filtered Views allow you to only look at certain types of traffic in your View. A common filter is something like “exclude traffic from your own company based on IP address.” It is important to note that filters are inherently destructive — they will permanently include, exclude, or alter your data set. So, you should always leave the first view unfiltered so you have a “ground-truth” version of the data.
There are a bunch of great reasons to use Filtered Views. In addition to filtering out traffic from employees by filtering out your corporate IP addresses, you can build a filter that includes data from just specific subdomains or directories on your site, such as a blog.
Track How Often Visitors Complete The Right Actions
Google Analytics allows you to create Goals at the View level. There are typically five main types:
- Destination (arriving at a specific page)
- Duration (sessions lasting a specific amount of time)
- Pages (for websites) or screens (for mobile apps) per visit
- Event (video plays, ad clicks, etc.)
- Smart Goals (very cool, but not applicable to most users)
PRO TIP: How Are Users Engaging on My Site? Which Content Drives the Most Online Activity?
If you want to discover how visitors engage with your website, and which content drives the most engagement and conversions, there are several on-page events and metrics you can track from Google Analytics 4 that will get you started:
- Sessions by channel. Which channels are driving the most traffic to your website?
- Average session duration. How long do visitors spend on your website on average?
- Pageviews and pageviews by page. Which pages on your website are viewed the most?
- Total number of users. How many users engaged with your website?
- Engagement rate. Which percentage of your website visitors have interacted with a piece of content and spent a significant amount of time on the site?
- Sessions conversion rate. How many of your website visitors have completed the desired or expected action(s) and what percentage of them completed the goals you’ve set in Google Analytics 4?
And more…
Now you can benefit from the experience of our Google Analytics 4 experts, who have put together a plug-and-play Databox template showing the most important KPIs for monitoring visitor engagement on your website. It’s simple to implement and start using as a standalone dashboard or in marketing reports!

You can easily set it up in just a few clicks – no coding required.
To set up the dashboard, follow these 3 simple steps:
Step 1: Get the template
Step 2: Connect your Google Analytics account with Databox.
Step 3: Watch your dashboard populate in seconds.
A Destination Goal might be getting users to reach a sign-up page. An Event Goal might be purchased item.
You also have the option of assigning a monetary value to Goals. This is usually around the value of a customer relative to a specific goal. If you know that one specific landing page converts 20% of offer-takers into customers, and the customer value is about $1,000, then that landing page goal has a value of about $200.
Measure How Different Groups of Visitors Use (Or Don’t Use) Your Site
Segments are subsets of users — i.e. from a specific country, or those who arrived to a certain landing page. You can also use Segments to break users down by:
- Demographics
- Their type of technology
- Specific behaviors
- E-commerce purchases
Segments allow you to discover how different types of visitors find and use your site. Are mobile users clicking on the desired link? What percent of visitors in California complete your Goal compared to visitors in Massachusetts?
Dimensions and Metrics let you quickly customize your analysis. Dimensions allow you to divide up your visitors based on specific characteristics, like time spent on site, device being used to access your site, number of return visits, or city location. You can compare first time visitors to 5-time visitors to 10-time visitors, for example.
Metrics are the quantitative measurements, such as “Sessions.” These are the more traditional digital marketing metrics, like Average Number of Pages Viewed or Average Session Length. You can use dimensions and metrics to identify your ideal visitor, and how they use your site/app. As explained in a great guide on OptimizeSmart, your reports will contain both Dimensions and Metrics:
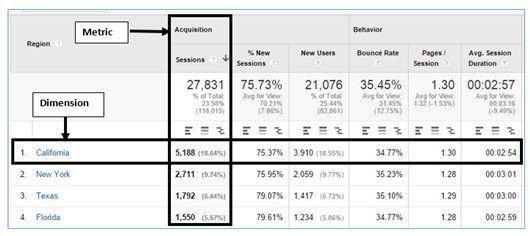
Dimensions provide context for Metrics; standalone metrics in your marketing would be meaningless to report. If you told a client they had 5,188 sessions (a Metric), it doesn’t matter much unless they know the type of visitors (i.e. people who are based in the US) that make up the 5,188 sessions (the Dimension).
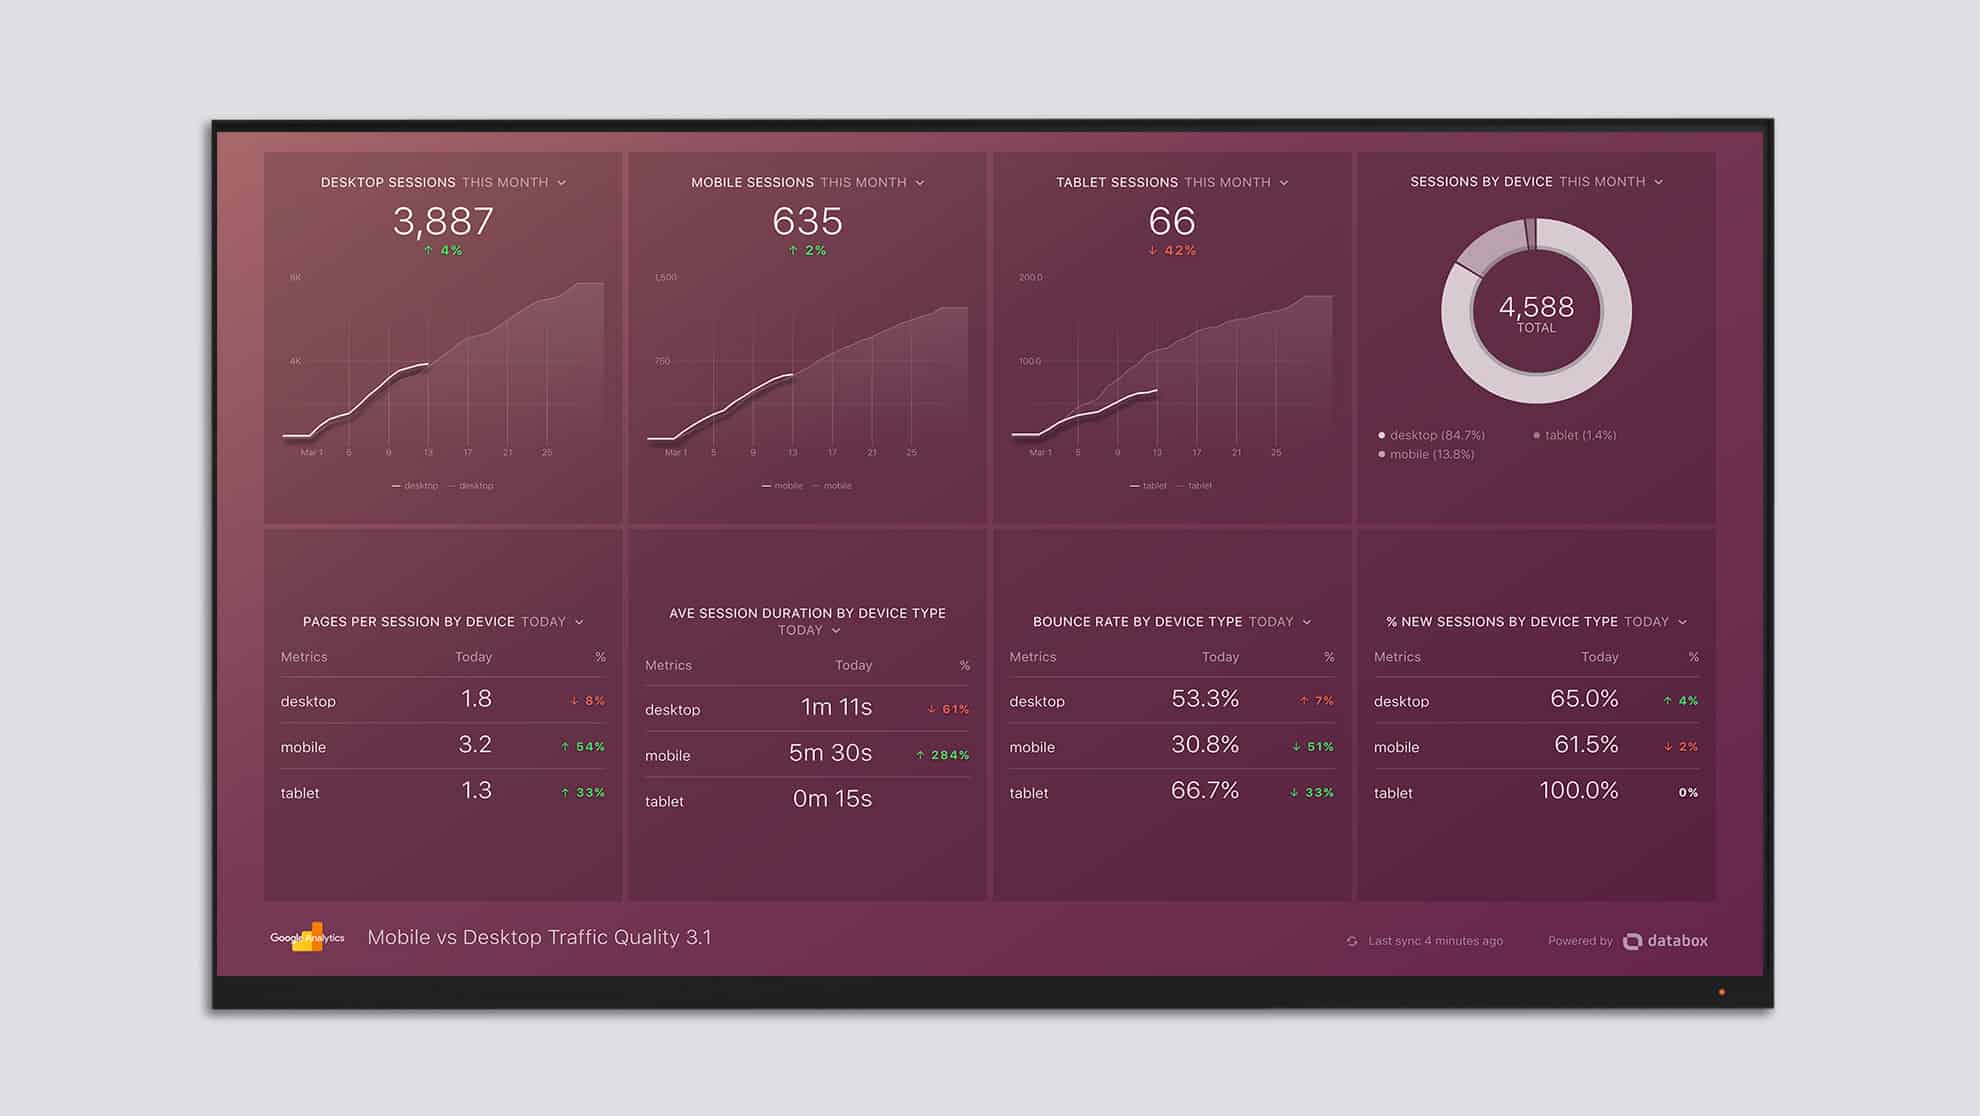
Looking at bounce rate (a metric) vs device category (a dimension) is another example of the importance of understanding the difference between metrics and dimensions. By looking at a bunch of metrics by dimension device category, as in the dashboard below, OverGo Studio was able to identify an opportunity for improving their client’s mobile website. They drastically increased inquiries as a result.
Track the Results of Your Campaigns
Begin here by understanding how Google defines three core concepts: Source, Medium, and Campaign.
- Source is usually the website or main source in which a link will be placed.
- Medium is the marketing activity of the campaign (i.e. PPC, email)
- Campaign is the name of the campaign you set in GA (i.e. “Summer Launch”)
Those are the three required UTM Parameters when you set up a marketing campaign. UTM stands for Urchin Tracking Module, which dates back to a company Google bought in 2004. To effectively track a marketing campaign in GA, you need to set up a Source, a Medium, and the overall Campaign name. There are also two optional UTM parameters:
- Campaign Term: You use this to track keywords in an AdWords campaign.
- Campaign Content: This is for split-testing ads and seeing which copy performed better.
Google has a Campaign URL Builder where you can build trackable URLs with all the required UTM parameters pretty easily. This will allow for a much better understanding of the performance of all your campaigns.
An example: if you use MailChimp to send your email marketing, but you don’t have link tagging for Google Analytics installed, your GA reports won’t show that traffic as coming from email. Consistent tagging for better campaign tracking is crucial front-end work in marketing.
Another example: Let’s say you just announced a big new product, and you want to spread the news through all types of channels: social, email, AdWords and more. You could create a custom URL for each Medium, and always set the Campaign parameter to “newproductlaunch”. That way, you will know which Medium or Source brings in the most qualified traffic.
GA Channel definitions show your options for the Medium parameter. There are currently nine Channels:
- Direct: User went directly to the URL or a bookmark. People that hear about your company from an offline source will usually be in this bucket.
- Organic search: User came in through clicking a link after a Google search (not an ad)
- Social: Visits from social networks
- Email: Traffic from sent emails, i.e. newsletters
- Affiliate: Visitors who arrived from affiliate marketing efforts
- Referral: Someone clicks a link on another site (excluding major search engines) and that lands them on your site, and it’s counted as a referral
- Paid search: PPC campaigns
- Other advertising: Visitors from advertising other than search and display, such as cost-per-view video advertising
- Display: This is traffic from display advertising, such as re-marketing campaigns
Since GA automatically categorizes traffic into these buckets when possible, you can get instant insights without using UTM parameters as well.
Create a Measurement Plan Before You Start Your Marketing
You have plenty of options when it comes to analyzing incoming traffic with GA. You can watch all the videos and read all the documents, but until you fully grasp how Google organizes your incoming visitor data, it’s hard to fully optimize what you can do with the platform for your team or clients.
There might even be entirely new ways — segments, filters, etc. — to use GA that you hadn’t considered yet. That’s one of the tenets of digital marketing: always be experimenting. Try new things, see what the data tells you, and then try a slightly different variation again. Google Analytics can be your guide, but first you need to understand the key terminology it uses. So create a new View, and give it a shot!


