


Table of contents
Your website has pages and pages of content. Your email subscriber list is growing, and your lead forms are being filled out.
But without setting up the proper Google Analytics tracking, it is impossible to determine exactly where your conversions are coming from or how customers move down your funnels.
Are you ready to learn how to set up and use Google Analytics conversion tracking and unlock the real potential of Google Analytics reporting?
To help you get beyond the basics and get the most out of your conversion data, check out how 50+ Google Analytics experts weigh in on:
- How to Set Up Conversion Tracking in Google Analytics
- 9 Tips for Setting Up Google Analytics Conversion Tracking

How to Set Up Conversion Tracking in Google Analytics
If you already have Google Analytics running within your website (or your client’s), then getting basic conversion tracking set up is fairly straightforward:
Use Google’s Campaign URL Builder to create custom URLs. This will allow you to pinpoint the source of a click within Google Analytics.
Define your goal within Google Analytics. You can follow the steps below to set up basic goals.
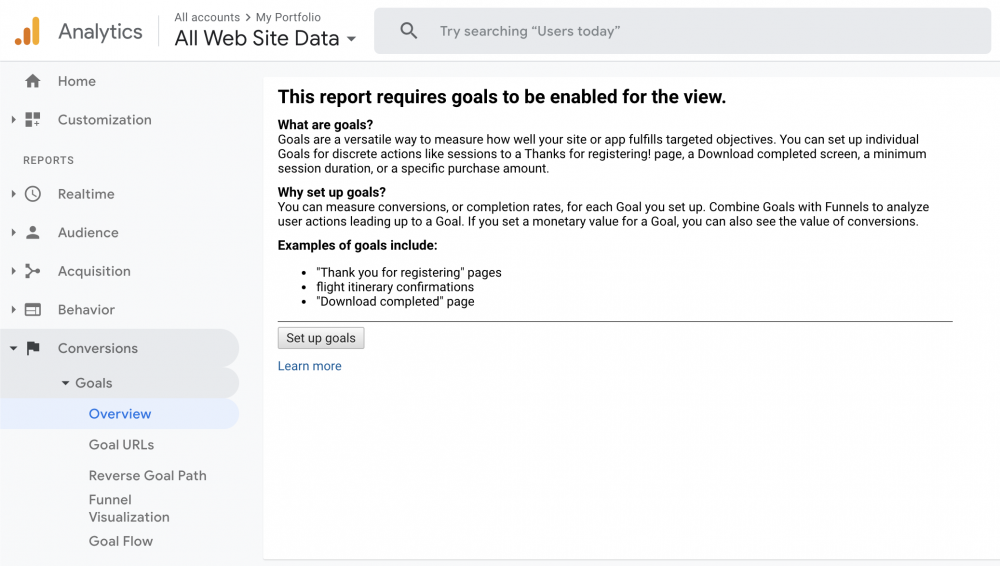
Under the “Conversions” tab, select “Overview.” Then, click the button “Set up goals.”
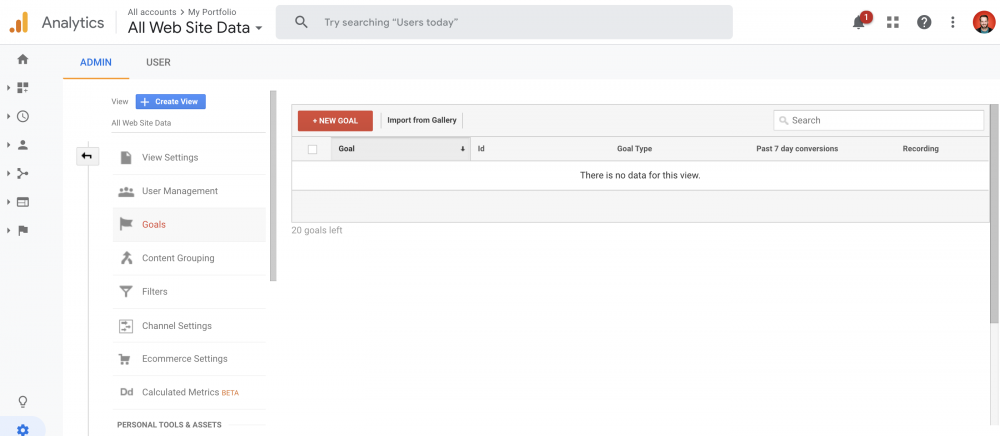
Select the red “New Goal” button, then use a template or custom goal slot.
These are truly just the first steps to tracking conversions in Google Analytics. The program can be difficult to set up effectively, even for the experienced user. And setting up a goal in Google Analytics is just the start – the ultimate mission is to increase conversions and grow your business.
To help you get beyond the basics and get the most out of your conversion data, we asked 53 digital marketing experts for their best tips on using Google Analytics to track conversions. The tips included work you should do before even setting up your Google Analytics dashboards, how you should configure Google Analytics itself, and what you should do to improve results once everything is up and running.
9 Tips for Setting Up Google Analytics Conversion Tracking Properly
Setting up Google Analytics to do exactly what you need can be difficult and take lots of technical skills. Fortunately, our experts dove into the nitty-gritty of the software tool.
- Ensure Data Quality
- Simplify Your Data and Dashboards
- Properly Set Up Goal Tracking
- Use Conversion Path Reports
- Define Events and Identify Lead Sources
- Create and Use Custom Segments and Multi-Channel Funnels
- Create a Thank-You Page
- Use UTM Codes and Properly Structure URLs
- Define the Stages of Your Funnel
PRO TIP: How Are Users Engaging on My Site? Which Content Drives the Most Online Activity?
If you want to discover how visitors engage with your website, and which content drives the most engagement and conversions, there are several on-page events and metrics you can track from Google Analytics 4 that will get you started:
- Sessions by channel. Which channels are driving the most traffic to your website?
- Average session duration. How long do visitors spend on your website on average?
- Pageviews and pageviews by page. Which pages on your website are viewed the most?
- Total number of users. How many users engaged with your website?
- Engagement rate. Which percentage of your website visitors have interacted with a piece of content and spent a significant amount of time on the site?
- Sessions conversion rate. How many of your website visitors have completed the desired or expected action(s) and what percentage of them completed the goals you’ve set in Google Analytics 4?
And more…
Now you can benefit from the experience of our Google Analytics 4 experts, who have put together a plug-and-play Databox template showing the most important KPIs for monitoring visitor engagement on your website. It’s simple to implement and start using as a standalone dashboard or in marketing reports!

You can easily set it up in just a few clicks – no coding required.
To set up the dashboard, follow these 3 simple steps:
Step 1: Get the template
Step 2: Connect your Google Analytics account with Databox.
Step 3: Watch your dashboard populate in seconds.
1. Ensure Data Quality
Your decision-making about conversions will only be as good as your data. There are some simple steps you can take to ensure it is as accurate as possible.”Make sure to filter your company IP addresses within Google Analytics,” says Daniel Cooper of Lolly. “As you develop your site and work on things you don’t want your own visits to your website counting as pageviews as this can potentially skew not only data like bounce rate and dwell time but also your website’s conversion rates.”
“One of the biggest challenges for measuring conversions in Google Analytics is that goal tracking can easily break (whether it’s double-counting, updates to the site, or forgetting to add a new conversion flow),” says Ryo Chiba of Topic. “Our best tip to overcome this is to bake Google Analytics goals into regular, highly visible reports that are sent to senior management. This forces us to regularly audit the accuracy of the goals and increases trust in the numbers.”
“Never view data with your blinders on!” cautions Sarah Donawerth of Carro. “By that, I mean that data should be taken in context. Even if sales are down for the day, what does the weekly view tell us? Monthly view? The bigger insights are not in the smallest of changes, but in the overall trends of your data.”
2. Simplify Your Data and Dashboards
And even when your data is good, looking at too much at once can add unnecessary clutter and noise.
“Set up a clear overview of the metrics and charts that focus just on your lead generation goals,” says Lennart Meijer of TheOtherStraw. “It is easy to get distracted by all the data in Google Analytics. However, if you have clear lead generation goals for certain pages, setting up simple dashboards that just track what you need is key to using this data to optimize your lead generation strategies.”
“Have a separate landing page for each goal conversion,” advises Luke Wester of Miva, Inc. “This way, you can track individual conversions easier. It will also help you decide which campaigns or pages generate the best leads for your business.”
3. Properly Set Up Goal Tracking
We explained the basics of setting up goals in Google Analytics. However, doing it the best way for your site will take more than just the basics.
“If you don’t have any goals set up you can’t measure how successful your campaigns have been,” says Osama Khabab of Motioncue. “Whatever your objective, always set up some goals for your website for lead generation, signups, purchases, add to carts, etc.”
“First of all, add goals in the admin->goals->new goal,” says Maggie Simmons of Max Effect Marketing. “By adding the goals, you will be able to check the goals in the conversions->goals menu. And you can check the overview of goals, goal URLs , reverse goal path, and goal flow. The reverse goal path shows the last three URLs from where the user entered the site and how the user converted. Goal URLs show from which URL, we have got the conversion. We can also filter the conversions according to source/medium. We can also find the locations from which we have got the conversions.”
“At Venngage, metrics that matter to us are registrations, premium upgrades, creations (when someone creates a design using our templates) as well as completions,” says Aditya Sheth of Vengage. “By setting each of these metrics as goals, we can then visualize each step and address any issues between these goals by looking at them individually and as a whole.”
“Break your conversion tracking into Macro and Micro goals,” recommends Elad Levy of Fixel. “Macro goals are the ones that have clear monetary value, e.g. purchases or leads. Micro goals don’t have a clear monetary value, but are important for monitoring site health and traffic quality, e.g. engagement level (Scroll depth, time on site etc.).”
“Do not track your micro conversions as a goal,” counters Stéphanie Erné of Vsee Search Marketing. “Only track your most important conversion as a goal. This way the conversion percentage that is reported is not a higher metric than it actually is. You do not want your newsletter sign-ups to count towards this percentage. Keep your newsletter sign-ups and less important button clicks or pageviews as events or in the all pages report and analyze them from there if necessary.”
“When we onboard clients that have attempted to use Google Analytics to measure their conversions and lead generation we see issues with how previous companies have set up goal tracking,” says Bryan Pattman of 9Sail. “Make sure you set up meaningful goals and create a system that allows you to check if the the goals that you set align with the amount of business that you are bringing in. Finding the right KPIs will help you make very important decisions that will help you continue to grow your business’ online presence.”
4. Use Conversion Path Reports
One tool within Google Analytics that was mentioned frequently by respondents is the conversion path report feature. It can help users determine how their site visitors became converters, not just the final conversion point.
“This tool shows you the most effective paths that led to conversions,” says Jacqueline Tihanyi of Fisher Unitech. “Navigating to the top conversion paths in Google Analytics is easy. To do this follow these steps: Conversions —> Multi-Channel Funnels —> Top Conversion Paths.
“This will group channel paths and list the most effective conversion paths, showing the figures as well as the % share,” Tihanyi continued. “This gives you insight into the strategies that work and don’t work in a clear and concise fashion.”
“It is crucial to know how the customer gets to us, which channels strongly drive him to conversion,” says Krzysztof Surowiecki of Hexe Data. “Thanks to this, we can better distribute the budget between the sources that appear on the paths of customers, not only at the end but also at the beginning and in the middle of its path, who buy the most.”
5. Define Events and Identify Lead Sources
Creating and defining events in Google Analytics shows you when specific actions are taken on your site. Doing this correctly can help you in measuring conversions and better understanding your funnels.
“The best way to measure conversions and lead generation using Google Analytics is by creating events,” explains Jonathan Aufray of Growth Hackers. “With GA, you have the possibility to track events. In other words, you can see the actions your visitors take when visiting your website. If your goal is to have visitors signing up to your newsletter, you can track it on Google Analytics. If you want them to click a CTA button and go to a specific page such as a signup form or a contact page, you can create an event for this on GA.”
“A goal funnel is a navigation path that outlines how your online users are expected to follow to achieve a non-transactional website goal,” explains. Patricio Quiroz of Code Authority. “You can track actions such as submitting a contact form, button clicks, and account creations. Once a visitor performs the specific action of your goal then Google Analytics will record it as a conversion. This is a great way to analyze where your audience gets uninterested or where your audience is more prone to converting into a customer.”
“Understanding lead source is crucial to audience segmentation,” shares Dinah Adams of Futurety. “Knowing where your most qualified leads come from adds much-needed context and can improve future lead generation campaigns.”
“Build custom channel groupings so that you can measure the true impact of different sources and mediums,” advises BJ Enoch of Opendorse. “Your top conversion paths and assisted conversions become exponentially more valuable when you can drill down to granular levels.”
“With Google Analytics, considering the two selected segments, i.e., converters and non-converters, there are 4 variants of dimensions and metrics combined that derive the most precise results,” says Sanya Aru of MakeWebBetter. “Analyzing these 4 variant aspects may generate the most accurate insights. The 4 dimensions to look upon are-
- New Vs Returning Visitors
- User Pattern according to country
- Ads Campaign performance
- Cohort Analysis (non-converted returning visitors)”
6. Create and Use Custom Segments and Multi-Channel Funnels
Segments are used for many things in Google Analytics. They can filter basic things, like just organic traffic, or help you drill down to specific audiences. “The use of Google Analytics tool called Multi-Channel Funnels can help here,” says Maksym Babych of SpdLoad. “This is the section in the ‘Conversions’ tab that shows the lead path for clicks on your site. This tool allows you to evaluate the contribution of previous visits and traffic sources: other websites, search queries and ads, how much time has passed from the first click or view to conversion. “It takes into account interactions with virtually all digital channels,” Babych continued. “These include, but are not limited to:
- regular search and search advertising (in all systems, taking into account queries)
- sites – referral sources
- partner sites
- social networks
- electronic newsletters
- special campaigns, including those in traditional media that direct traffic to shortened URLs.”
“Instead of only looking at the data overviews that Google Analytics gives you and calling it a day, I recommend going into the tool with a set of questions you want answers to,” recommends Ruba Aramouny of SOLID Marketing. One of the first things you can do is to use the ‘Segments’ feature at the top of the interface. To do this, create segments that are meaningful to your business and then use them to compare visitor behavior:
- Do new users visitors behave differently than repeat visitors?
- Do people from certain geographic locations convert better than others, or spend more time on your site?
- Do different combinations of traffic sources and visitor types convert better or worse?
Segments will help you analyze your site visitors in more detail and shape marketing efforts better in the future,” Aramouny added.” I will highly suggest users jump into Conversions Tab and move ahead to multi-channel funnels where you can find top recommendation paths,” says Farasat Khan of IsItWP. “Within this report, you might want to check on different mediums such as Organic, Social, etc. This shows the picture-perfect conversion from first to the last touch of a user.”Analyze the Multi-Channel Funnels report more often,” offers Carol Hill of Analytics Help. “A lot of business owners and marketers use only the ‘All Traffic’ and ‘Campaigns’ reports when analyzing the performance of a particular traffic source or campaign but this is misleading since those reports usually use the default attribution model which in Google Analytics is last non-direct click and assumes that users use a linear path and a single source before converting.”
“But what the Multi-Channel Funnels reports are showing is the opposite, with a big portion of users using multiple traffic sources before converting,” continued Hill. “And since those traffic sources don’t get any credit when analyzing the data with the last-non-direct click attribution model, this may lead some marketers to think that the other traffic sources are not contributing to the conversion, which is not true.”
7. Create a Thank You Page
One way to confirm a conversion is to create a “Thank You” page appears after an action is taken. Many experts recommended using this trick to help save time and show accurate data.
“When users submit a ‘lead,’ have them redirected to the ‘Thank You’ page in order to easily track the amount of leads by tracking the analytics on the Thank You page,” Dustin Moore of Ivio Agency says. “Be sure to not link the page anywhere else on your site so your metrics are accurate and clear. Following this, set up a “goal’ in the GA account in order to easily access the analytics.”
“The best way to measure your conversions in Google Analytics with the LEAST AMOUNT of coding or site revision is to create destination ‘Thank you’ pages in Google Analytics to count your lead conversions,” says Phil Mackie of TopSailDigital. “By configuring your Google Analytics goals to fire when a visitor lands on your ‘thank you’ page, you can skip custom Javascript implementations and get your goals tracked sooner, rather than later.”
“Create a conversion goal for views of the pages that a visitor sees after submitting a form,” recommends Theresa Keller of Delta Marketing Group. “An example is: /contact-us/thank-you is the page you want to trigger the conversion. Based on which form/thank you page they submit, you can also assign values. A generic contact us submission might have a lower value as a conversion than a form on the pricing page or a specific content offer/services page.”
8. Use UTM Codes and Properly Structure URLs
UTM tags are Google’s own solution for tracking traffic data and properly setting them up is key to measuring conversions.
“Use UTM tags for paid non-Google campaigns plus import costs of Google campaigns in order to analyze campaign costs, ROI and payback,” recommends Viacheslav Ponomarev of 49.95 Agency.
“Make sure you have a clear success URL to define goals in Google Analytics and that all pages are tagged,” says Julien Coquet of Julien Coquet Consulting. “That way you can collect extensive data on all pages and events contributing to conversion.”
9. Define the Stages of Your Funnel
A major aspect of measuring conversions is knowing the funnel you’ve created and understanding how your prospects move down it. Knowing all your funnel stages will help you set up proper goals and events in Google Analytics (as we’ll get into later).
“Before diving into Google Analytics, take time to categorize website activity into upper-funnel engagement versus lower-funnel engagement,” advises Jackie Jeffers of Portent. “Upper-funnel engagement is usually interaction with content that’s ungated and easily accessible, such as a blog. Lower-funnel engagement comes from users who are further along in their research process and are more willing to exchange personal info, like an email address, for gated content. Categorizing web activity gives you a roadmap for a user journey,” Jeffers continues. “By doing that pre-work before going into GA, you’ll have a better idea of which metrics to focus on for conversions at different phases of the conversion funnel.”
“Don’t just measure bottom-of-the-funnel activity,” warns Thomas Bosilevac of MashMetrics. “What percentage of users come to your site and purchase on their first session? Likely less than 5% if you are an ecommerce site. By tracking conversion queues such as watching a video, scrolling through 75% of blog content, clicking on partner content you can start to understand what leads to conversion…the other 95%. Furthermore, these queues can also be used to remarket your audience at different levels with unique messages.”
Are you looking for a more visually sophisticated tool that creates beautiful funnel presentations, charts, and all sorts of graphics to better report on conversions through tools like ActiveCampaign, Google Analytics, Adobe Analytics, and many more? Look no further than Google Analytics reporting tools like Databox. With such visuals, you will be able to look for trends over time and compare the performance of different campaigns to see which ones are driving the most traffic and conversions.


![How to Leverage Your Website Analytics to Acquire New Customers? [Research Findings Based on 100+ Companies]](https://cdnwebsite.databox.com/wp-content/uploads/2022/10/10044001/google-analytics-4-metrics-and-dimensions-guide-1000x563.png)


