


Table of contents
What percentage of your audience is browsing on a mobile device?
How many people are checking out your site in Canada?
How many people are viewing your site in Chrome?
Using Google Analytics’ Audience Overview Report, you can answer all of these questions and many more.
In this post, we’re sharing how to make the most out of the Audience Reports including:
- What is Audience Overview?
- How to track Audience Overview in Google Analytics
- How to Add an Audience in Google Analytics
- 14 Things You Can Learn from Audience Overview

What is Audience Overview?
Audience overview is one of the first reports that you see when you log into your Google Analytics account.
However, in order to get the most use of this report, let’s take a step back and define an “audience” in Google Analytics.
Google Analytics defines an audience as, “users that you group together based on any combination of attributes that is meaningful to your business.”
For example, you could have an audience of people who bought a specific product on your website or all-female visitors between 18-34.
To get the most use of this report, you must enable demographics and interests.
Related: Google Analytics Reporting: A Complete Guide to Reports, Metrics, Dimensions, and More
How to track Audience Overview in Google Analytics
To see your Audience Overview Report, log in to Google Analytics, and click on Audience → Overview on the left-hand side.
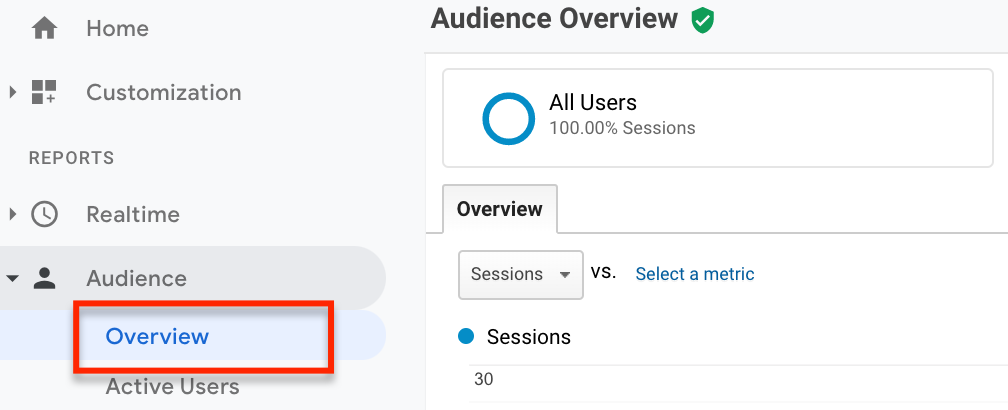
The Audience Overview Report gives you a quick snapshot of who is visiting your site, where they are coming from, what type of device they are on, and how long they are staying.
The metrics you’ll find in this report include:
- Sessions
- Users
- Pageviews
- Pages/Per Session
- Average Session Duration
- Bounce Rate
- Percentage of New Sessions
You’ll also see a pie chart of new vs. returning visitors.
It also shows a preview of location demographics (i.e. language, city, and country), desktop systems (browser, operating system, and service provider) and mobile systems (operating system, service provider, and screen resolution).

If you want to dive deeper into audience insights, you can pull up specific reports under the Audience tab including:
- Active Users
- Lifetime Value
- Cohort Analysis
- Audiences
- User Explorer
- Demographics
- Interests
- Geo
- Behavior
- Technology
- Mobile
- Cross-Device
- Custom
- Benchmarking
- User Flow
Pro Tip: Your Go-To Dashboard For Doing a Deeper Dive on Website Traffic and Conversion Sources
Struggling to find an easy yet effective way to gain a comprehensive understanding of your traffic sources, user behavior, and revenue generation?
You can do all that and more with our plug-and-play GA4 Acquisition dashboard template:
- Understand user acquisition: See where users come from, tailor outreach, and track new user growth;
- Focus on high-performing channels: Identify top channels, optimize resource allocation, and adjust underperformers;
- Track revenue & engagement: Monitor revenue growth, active users, and the effectiveness of your campaigns;
- Go beyond traffic & conversions: Gain deeper insights into demographics, sales, customer journeys, ARPU, and more;
- Optimize marketing & drive results: Make data-driven decisions to improve your marketing strategy and achieve business goals.

You can easily set it up in just a few clicks – no coding required.
To set up the dashboard, follow these 3 simple steps:
Step 1: Get the template
Step 2: Connect your Google Analytics 4 accounts with Databox.
Step 3: Watch your dashboard populate in seconds.
How to Add an Audience in Google Analytics
In addition to the pre-built audience reports, you can also create your own audiences within Google Analytics.
To get started, click on Admin → Audience Definitions.
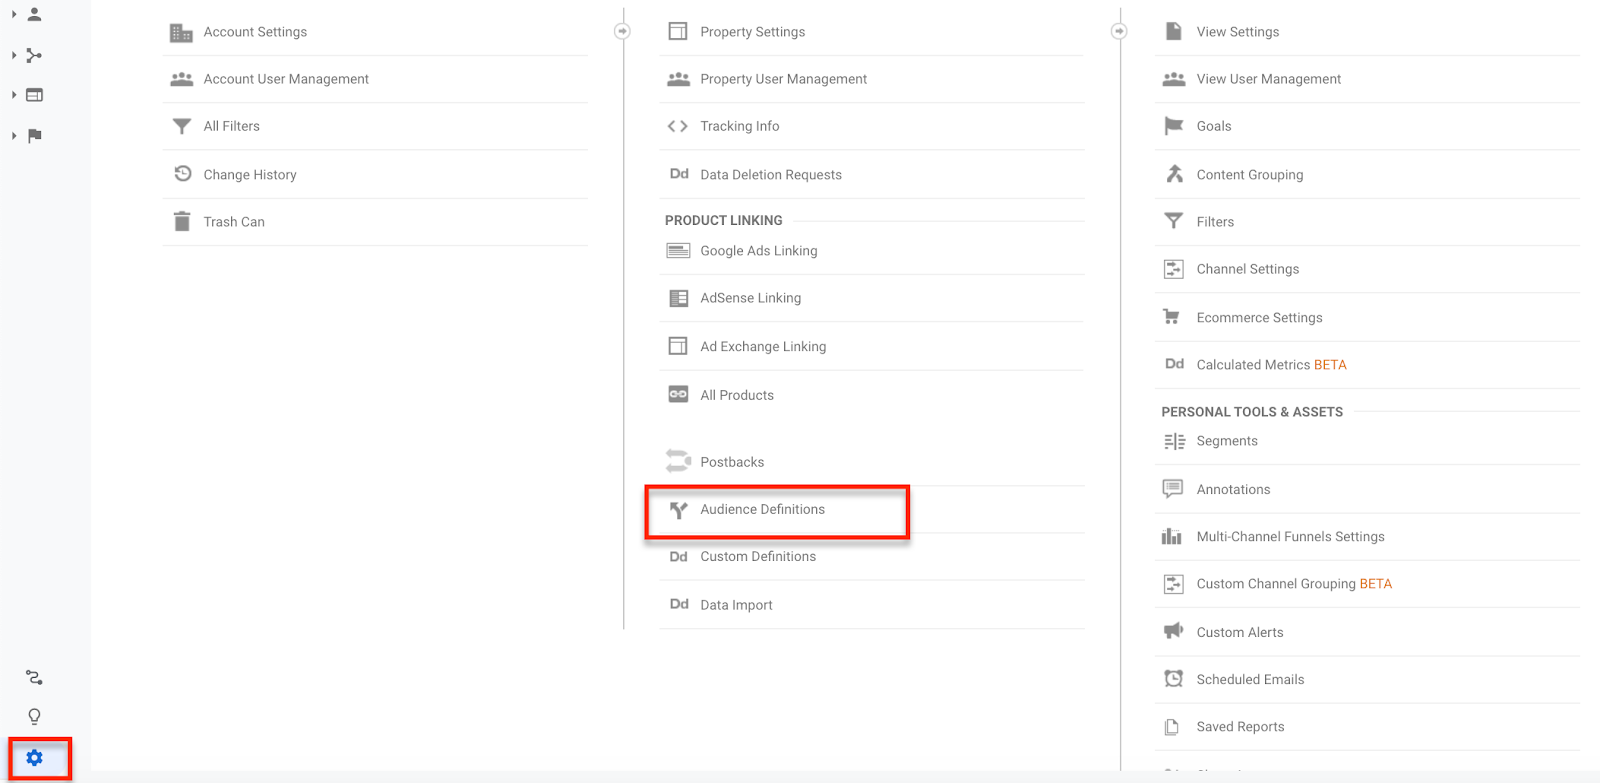
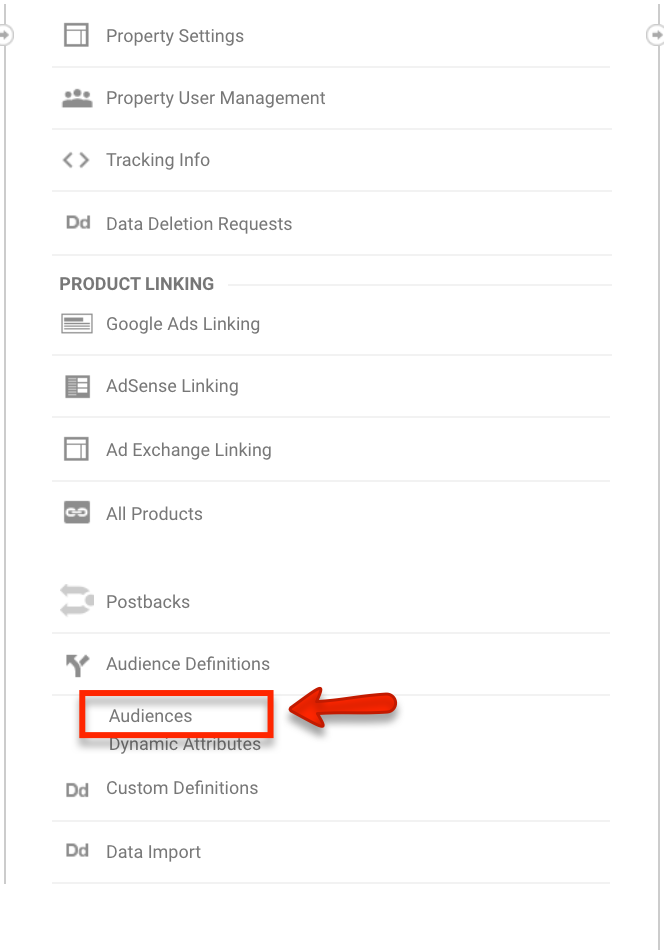
Then, click on Audiences under Audience Definitions.
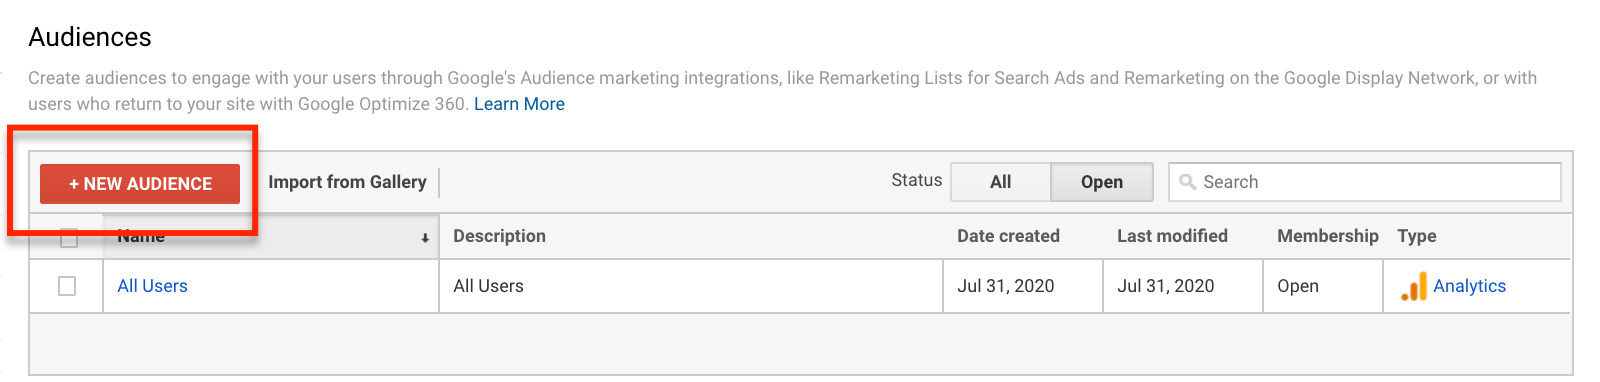
Now, click on New Audience.
Editor’s Note: If you are setting up your first audience in Google Analytics, you’ll need to enable remarketing in Google Analytics before you can create your first one.
Once you create a new audience, you’ll now have to define your audience. Google Analytics presents three different audiences:
- Use a recommended audience
- Create a new audience
- Import segment
If you are new to Google Analytics, we’d suggest starting with the recommended audiences.
These recommended audiences include:
- Smart List – an auto-generated list that Google creates based on audiences that are similar to yours.
- All Users
- New Users
- Returning Users
- Users who visited a specific section of your site, such as a specific product page
- Users who completed a goal completion, such as signing up for your newsletter
- Users who completed a transaction

Next, it’s time to name your new audience. For example, if you are creating an audience for anyone who signs up for your newsletter, you can call it, “Newsletter Subs.”

And then, select a specific audience destination. This is normally your specific website or one of the properties you created within your Google Analytics.
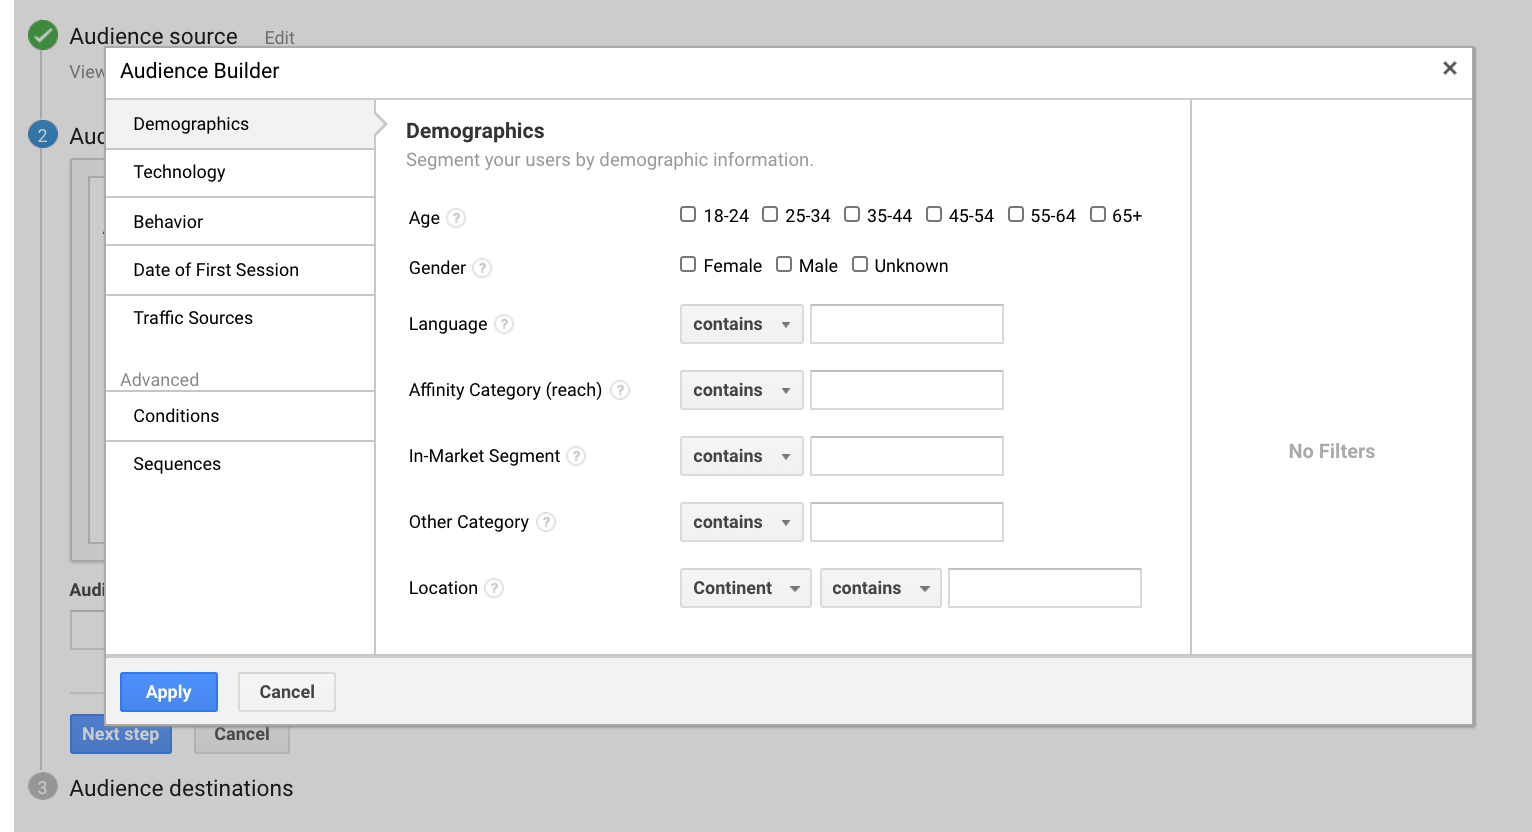
Now, if you want even more customization, you can build your own audiences, based on any number of user attributes, such as demographics, technology, behavior, date of first session, traffic sources, etc.
For example, you could create a new audience for any newsletter subscribers, who are between 25-54.
The third and final way to create a new audience is to import a custom segment. For example, you can create a custom segment for traffic from Facebook Ads or Organic Search.

Note: You can create up to 50 different audiences for a single Google Analytics account, and up to 20 for a single property within that account.
14 Things You Can Learn from Audience Overview
With so much information at your fingertips, we asked 40+ marketers to share their top insights from the Audience Overview Report. Here’s what we learned:
- Demographics
- Email Subscriber Demographics
- Desktop vs. Mobile Usage
- Screen Resolution
- Interests
- Custom Segments
- User Behavior
- New vs. Returning Users
- Bounce Rate
- Average Session Duration
- Pages Per Session
- User Flow
- Location
- Languages
1. Demographics
“The audience overview includes the demographics of your users, showcasing their age and gender, along with their personal interests,” says Andrew Ruditser of MaxBurst. “This is extremely helpful when figuring out who your target audience is and what type of audience you should focus your marketing to, giving you a greater chance of catching users attention.
If your audience is too broad, you will waste time and money marketing to users who will have no interest. Once you learn the data of your target audience, you can track what strategies catch these users’ attention best within the sessions overview. This is why Google Analytics Audience Overview is important to use when learning your website insights.”
Bernadette Kelly of ActiveWin Media says, “There are loads of information to gather from GA. My favourite is the demographic information on who is visiting the site. It enables you to build a persona of your target market, and customize your content and tone of voice to match.
For example, if your unique visitors are male aged 18-24, adopt a casual and friendly tone that appears to that audience. However, females aged 55-64 would need a completely different TOV.”
Liam Barnes of Directive adds, “Demographic insights for cities & states can be extremely helpful for creating localized content and ad targeting.”
2. Email Subscriber Demographics
“When running email campaigns we use Google Analytics audience overview to understand which parts of a marketing email campaign are most effective,” says Alex Destino of Digital Optimus.
“We do this by comparing customer response rates by audience segment and then investing more in the audience segments where the campaign has the highest ROI.”
Related: 23 Effective Ways to Reduce Email Unsubscribes
3. Desktop vs. Mobile Usage
“One of the biggest features I use is the System tab,” says Crystal Khailo of Xtractor Depot. “This will pull up all operating systems for mobile and desktop. From here I can see if anything dropped within those two and make changes to the site using that data.”
Evan Morris of Corvus Janitorial System shares, “One major insight I have gleaned from Google Analytics’ Audience Overview is that the vast majority of our website’s traffic is on mobile devices.
Our team had been optimizing all of our pages for desktop, but once we realized more than 70% of our traffic was from mobile, we were able to create a better user experience and improve our bounce rate and average session duration.”
Chris Wilks of BrandExtract adds, “We consistently use Audience Insights to determine the technology habits of our users. This helps us optimize our site(s) for the devices and browsers that are most popular to our audience, which ensures a better user experience.”
For example, Cristina Maria of Commusoft says, “It’s been very interesting to see in the past three months how users have switched from viewing our website on a mobile to viewing it on desktop. This has informed a little of our effort towards producing lengthier content (which is easier to browse and experience at leisure on a desktop) rather than the easy to skim, super-visual content we did when mobile was more of a priority. This being said, a balance of both is usually ideal.”
Related: A Beginner’s Guide to Mobile Website Optimization
4. Screen Resolution
“The most useful top-level insight I’ve garnered from the audience overview report has to be their metrics for screen resolution,” says Eleanor Bennett of Logit.io.
“This data can be used directly to inform designers & UX teams during the process of redesigning a website so that they are aware that your site needs to be responsive across various devices & screen sizes.
It is also worth using these insights to make sure content and key marketing messages aren’t being lost across popular devices used by your customers. It’s estimated by canonicalized.com that almost a quarter of the web’s most popular sites are not mobile-friendly, so overlooking stats around screen size and device type usage is still a surprisingly common practice by site owners.”
Elizabeth Weatherby of Youtech says, “Not only does it allow me to see the location by country of your users, but it allows me to note screen sizes belonging to my users. For example, I love being able to note the screen resolutions, like 375 x 812 or 414 x 736.
For example, this allows me to understand how exactly my users are seeing my website. The entire user experience of a website can differ greatly depending on the user’s screen size. Optimizing with screen size in mind is key. Knowing general screen size is also helpful when creating ads, landing pages, and designing/implementing graphics.”
Damien Martin of Shufti Pro adds, “Type of device and screen resolution helped us identify what should be our priority when fixing the website issues.”
5. Interests
“Interests is an advertiser feature that you need to manually enable to be able to see the data,” says Daniella Pozzolungo of PupDigital. “This shows you categories of users based on their interests and online shopping behavior.
Affinity categories show categories based on users’ interests. In-market segments show categories that users on your site are actively researching or looking to purchase in. You can use this information to not only get a better understanding of whether your existing marketing is targeting the right people but also help guide new audiences you can target with your marketing.”
6. Custom Segments
“Custom segments have been a key feature of Google Analytics for a while, allowing you to see traffic by channel, visitors who completed goals, demographic data, and much more,” says Aditi Jain of Inomagic Agency.
“Custom segments can be created from almost any facet of user data, including time on site, visits to specific pages, visitors who completed a goal, visitors from a specific location, and more.
Using segments helps you learn more about the users on your site and how they engage with it. One insightful area to explore when determining additional segments to create is in the Audience tab of Google Analytics.
If you navigate to Audience > Interests > Overview, the Overview will display a high-level look at three interests reports:
- Affinity Categories
- In-Market Segments
- Other Categories.”
Sam Olmsted of Spokane Digital Marketing adds, “As an SEO professional, one of the most important metrics I look at in Google Analytics is organic traffic. Inside Google Analytics’ Audience Overview, you can glean endless amounts of insight from the data. However, for SEO beginners, organic traffic is the best indicator of a campaign’s success.
You can see organic traffic by adding a segment in your search and clicking on “Organic Sessions.” Then, you can either keep the standard “All Users” segment to compare to or delete that segment to only see the organic traffic. Make sure to click on the date range in the top right corner to compare your campaign to last month, last year, or a custom range of your choice.”
7. User Behavior
“I think the most valuable insight gained from Google Analytics’ Audience overview is the behavior overview, which tells you how long a visitor spent on each page of your site,” says Kayleigh Duggan of Thoughtlab.
“By looking at how much or how little time is being spent on certain pages on your site, you can gauge which pages are most popular and contain the most relevant content. You should continue to create pages with similar content to the ones that visitors are spending the most time on.”
Chris Fernandez of Women’s Health Interactive adds, “How many of my visitors are first-time visitors vs. returning — a great way to understand site architecture, branding, and future marketing campaigns to try and increase the number of returning visitors based on their visitation patterns.”
8. New vs. Returning Users
“The primary metric you want to look at in Audience Overview is new visitors vs. returning visitors,” opines Alex Rouse of allmywebneeds.
Lauren Gast of Truck Driving Institute says, “Driving traffic to your website is of course one of the major goals of SEO. But how often do you consider not only who’s visiting your website, but who’s returning in the weeks and months to come?
One of the features of Google Analytics’ Audience Overview that I’ve found most helpful is the ability to track user loyalty.
By selecting Audience–>Behavior–>New vs. Returning, you can see how many people being drawn to your site are repeat visitors. Knowing how many customers visit your site more than once can help you figure out if you’re succeeding at customer retention. If your loyalty users are lower than you’d like, this tool gives you the opportunity to optimize for content that keeps visitors coming back for more.”
Joe Karasin of Karasin PPC adds, “The audience overview provides a nice visual insight into new and returning visitors to a website. By a quick glance at the pie chart, I can tell if I need to start looking into remarketing campaigns, or targeting new users.”
Jakub Rudnik of Shortlister agrees, “The insight I’ve found most valuable New vs. Returning user for a certain timeframe.
If you have benchmarks for that data, you can compare to your current timeframe or a specific timeframe to see how that audience is changing. It can be one metric to pull in for help in analyzing brand awareness: more returning users over time can be an indicator that the general public is growing more familiar with your brand.”
For example, Ashley Glenn of SSPR says, “For public relations specifically, we like to look at this report to measure the number of new vs. returning users to the website.
One of the biggest goals of PR is increasing brand awareness, so it’s important for us to see the number of new users steadily increasing over time. This doesn’t mean returning users aren’t important though. The number of returning users also needs to stay steady because that indicates that your brand is doing a good job of building strong relationships with consumers.”
“One insight that we’ve learned from Google Analytics’ is that the majority of our users (75%) are new users compared to 25% who are returning users, who are usually members of our executive team,” says Christine Nguyen of Limitless Foundation. ‘This has helped us understand how to market our website and to encourage new users from our social media to learn more about us through our website.”
And, Nikola Roza of Nikola Roza- SEO for the Poor and Determined adds, “I saw that 93% of my audience are new visitors, mostly from organic search. That is excellent and is a sign that my posts are ranking in Google. And I know by changing the time frame that my rankings are consistent and not too volatile, as my site’s traffic has always been mostly composed of new visitors.
However, I know I need to start my list and work hard on growing it because I want those repeat visitors too.
With a list, I’d be able to notify my subscribers whenever I publish something new. And that’s an instant influx of new visitors to the new post, but repeat visitors overall as they have obviously been to my site and became subscribers.”
However, you shouldn’t forget about converting more new users to returning users.
Freya Kuka of Collecting Cents says, “I pay attention to the percentage of my readers that are returning to my website. If the percentage is high, it means you are building a name around your brand. Most websites just survive on new visitors coming in each day through Google.
If you have repeat visitors, it is a sign that any products you create or services you offer could possibly be well received because you have an already loyal audience.”
Dylan Zsigray of Kiwi Creative adds, “One insight we pull from the Audience Overview page in Google Analytics is the ratio between new and returning users. We use this ratio monthly to see how compelling our content is for users as part of our overall nurturing campaigns.
If we lead users through the sales funnel with a variety of content in the awareness, consideration, and decision stages, we want to make sure they are continuing to visit the site. The new-and-returning users ratio is a great way to track this progress.”
9. Bounce Rate
“One section in particular that I’ve gained the most knowledge from in the Audience Overview in the Bounce Rate, which shows the percentage of users that immediately clicked off of your website after being directed to it,” says Cali Saturn of Direction.
“A high bounce rate could suggest that you need to provide better user experience, A/B test different landing pages, or optimize where you put your call to action. Typically, you want your bounce rate to be about 30-55%. If your rate is any higher than 65 or 70, that’s when you need to start examining your audience analytics.”
Lora Bovie of Choosing Therapy says, “Bounce Rate is such a simple metric that can tell you a lot about the health of your site and content. If your Bounce Rate is too high, then you may need to take a look at your content quality and how your site interacts with your audience, i..e. site speed and UX design.”
Michael Alexis of TeamBuilding adds, “Early in my website making history, I believed that having a bounce rate of 80% or so was okay; that meant at least 20% of people found enough value in my material that they would visit another page.
Now, I’ve flipped the target: I believe the most valuable websites aim for a bounce rate of no more than 20%. Of course, some people will pop-in and leave, but if you are targeting the right audience then they should stick around for more.”
Related: 76 Marketers on How to Reduce Your Website’s Bounce Rate
10. Average Session Duration
“Before taking a deep dive into the analytics, I like to look at the Pages/ Session and Average. Session Duration metrics as they let me know what the average visit looks like,” says Robert Spinrad of SEOM Interactive. “This especially applies to websites that encourage visitor engagement beyond the homepage conversion or transaction, such as product pages, blog posts, or a photo gallery.”
Rex Freiberger of Gadget Review adds, “This helps us see how engaging our content is, as well as our site overall. We have a target level of engagement that includes session duration, and when content underperforms, we can dig deeper and find out why this might be.
If we see abnormal results with this metric, we’ll take a look at where these views are being referred from, how often they’ve landed on the site, their bounce rate, and whether or not they come back to the site after leaving. With this information, we can make better-informed decisions about which content is drawing the most engagement.”
For example, Cierra Flythe of BoardActive says, “If it’s under two minutes, it is time to evaluate copy and content for digestibility. Push for that 2-3 minute duration metric as a standard average.”
11. Pages Per Session
“Pages per session is an important insight that can be learned from Audience Overview,” says Andrea Loubier of Mailbird. “If you’re hoping to learn if your online content is appealing – whether it be on your blog or landing pages – if visitors move on to more than one page, chances are that they are finding information that is of benefit to them.”
Karlee Tate of Acadian Windows and Siding adds, “With Pages/Session, you’re able to measure how engaged your audience is with your website. This metric shows the average number of pages viewed during one session. By using the Pages/Session metric, you’re able to indicate whether or not visitors are interested in the content on your website, giving us the opportunity to build relationships and encourage our visitors to take action.
While a higher average shows that our visitors are staying on our website and find value in our products and services, a lower average can indicate that we need to modify our website content to retain our visitors and keep them engaged.”
For example, Nate Rodriguez of LIFTOFF Digital says, “If I have a high bounce rate and low average time on page, but sessions and users are up, I know I have an issue with my content and not necessarily my SEO or rankings. If I see sessions and users are increasing and average time on page is increasing, I know I’m on the right track with my SEO and content.”
Related: Sessions vs. Users vs. Pageviews in Google Analytics: Everything You Need to Know
12. User Flow
“User flow is one of the best datasets that Google Analytics provides,” suggests Artjoms Kuricins of Tilti Multilingual.”It measures how users come and navigate your website, including the entrance and exit points.
Such information is essential, as it allows seeing if your marketing funnel actually works as intended. You can catch links that lead visitors astray, see what kind of information they gather on their path to being converted, or what exactly makes them not press that final Buy button.”
Antti Alatalo of Smart Watches 4 U adds, “Understanding the flow of a user through our website has been an interesting part of Google Analytics’ Audience Overview.
Seeing the ways visitors approach our site, how they search, land, and continue through the pages has pushed us to highlight specific parts of our site.”
13. Location
“Running a Location Report can help you to see where your site visitors are located geographically,” says Carrie McKeegan of Greenback Expat Tax Services. “This can be incredibly helpful when you’re devising your marketing strategies, as you can target your campaigns toward particular cultures.”
Michael O’Grady of Verdict Digital Marketing says, “I like to see what cities the website traffic is coming from within a client’s state. This allows me to determine our reach and ensure we are attracting local customers.”
Kevin Olson of Capitol Tech Solutions adds, “Several of our clients want to know where their website visitors are coming from. The audience overview allows you to check the country and city that your visitors are from. We include these data points on almost all of our clients’ monthly website analytics reports.
It also allows us to catch cities where there may be a high volume of bot traffic. For instance, if we are seeing a specific city with high numbers, but our target audience isn’t from that location, then we know that there is bot traffic coming from there and we can filter those numbers out in our reports.”
Faheem Dayala of Shayr Digital says, “Anything under GA’s Audience Overview needs to be taken with a grain of salt. That said, it’s a great 50,000-foot view of your audience. I’m always interested in geolocation data and mobile/technology data. ONE sight I’ve learned is how my website is being used and by whom. This allows for personalization and website optimization opportunities.”
For example, John Bedford of Viva Flavor adds, “The most important insight I’ve ever gained from the Audience view of Google Analytics relates to the Geo segment.
All of the keyword research I’d conducted for the launch of my site had been focused on the US market. Geo showed me that I was actually getting more traffic early on from the UK.
I was able to turn this into an immediate commercial benefit by firing up my Amazon UK account and connecting it through One Link far earlier than I’d planned to. That’s led to a very welcome increase in revenue.”
14. Languages
“One of the most important insights from the Audience Overview option within Google Analytics is the language extension of your website that users are utilizing,” says Melissa Kane.
“For example, approximately only 25% of internet users utilize English on the internet according to Sparkt.com (2020) while over 55% of the internet is published in English according to Unbabel.com (2015).
By understanding what languages your users are translating your site to, it provides you with an opportunity to improve your competitive advantage in the saturated online space by utilizing these languages to provide dedicated websites that are translated to your audiences prefer languages, that your competitors are likely not using.
This also provides you with higher chances of ranking within search engines because you are becoming accessible to some of the primary internet users outside of your native language. Once you know what languages your users prefer and have decided to optimize these opportunities you can provide content on these sites that are dedicated to the trends happening within your industry in their locations.”
Chris Gadek of AdQuick adds, “Being able to see which languages visitors speak and where they originate from geographically can be imperative when devising a marketing strategy. Understanding exactly how to tailor your campaigns to your audience is vital, and this information is key in establishing this with ease.”
In sum, Google Analytics’ audience insights allow you to get a better understanding of the types of visitors who are browsing your site. You can use this information to create a better user experience, improve your marketing efforts, and generate higher conversion rates on your site.


![How to Leverage Your Website Analytics to Acquire New Customers? [Research Findings Based on 100+ Companies]](https://cdnwebsite.databox.com/wp-content/uploads/2022/10/10044001/google-analytics-4-metrics-and-dimensions-guide-1000x563.png)


