Table of contents
How many leads did you generate from organic search traffic?
What percentage of sales came from social media?
How many new email subscribers did you get from Facebook ads?
These are all questions you can dig into with the help of Google Analytics custom dimensions.
Custom dimensions allow you to filter and make sense of your website data by drilling into specific elements of a metric, like the percentage of leads that came from social media vs. email, for starters.
In this post, we’re sharing 25 custom dimensions that you can use to analyze website conversions, including:
- Channels
- Navigation summary
- Acquisition overview
- Source/Medium
- UTM Campaigns
- Keywords
- Bounce rate
- User Behavior
- Lead generation costs / Cost per conversion
- Top conversions path
- Goal conversions by channel
- Conversions by page
- Goal completions
- Attribution
- Landing page
- Top sources per session
- User type
- Per session goal value
- Sessions to transactions
- User IDs
- Page value
- Event label
- eCommerce conversion rate
- Author
- Demographics

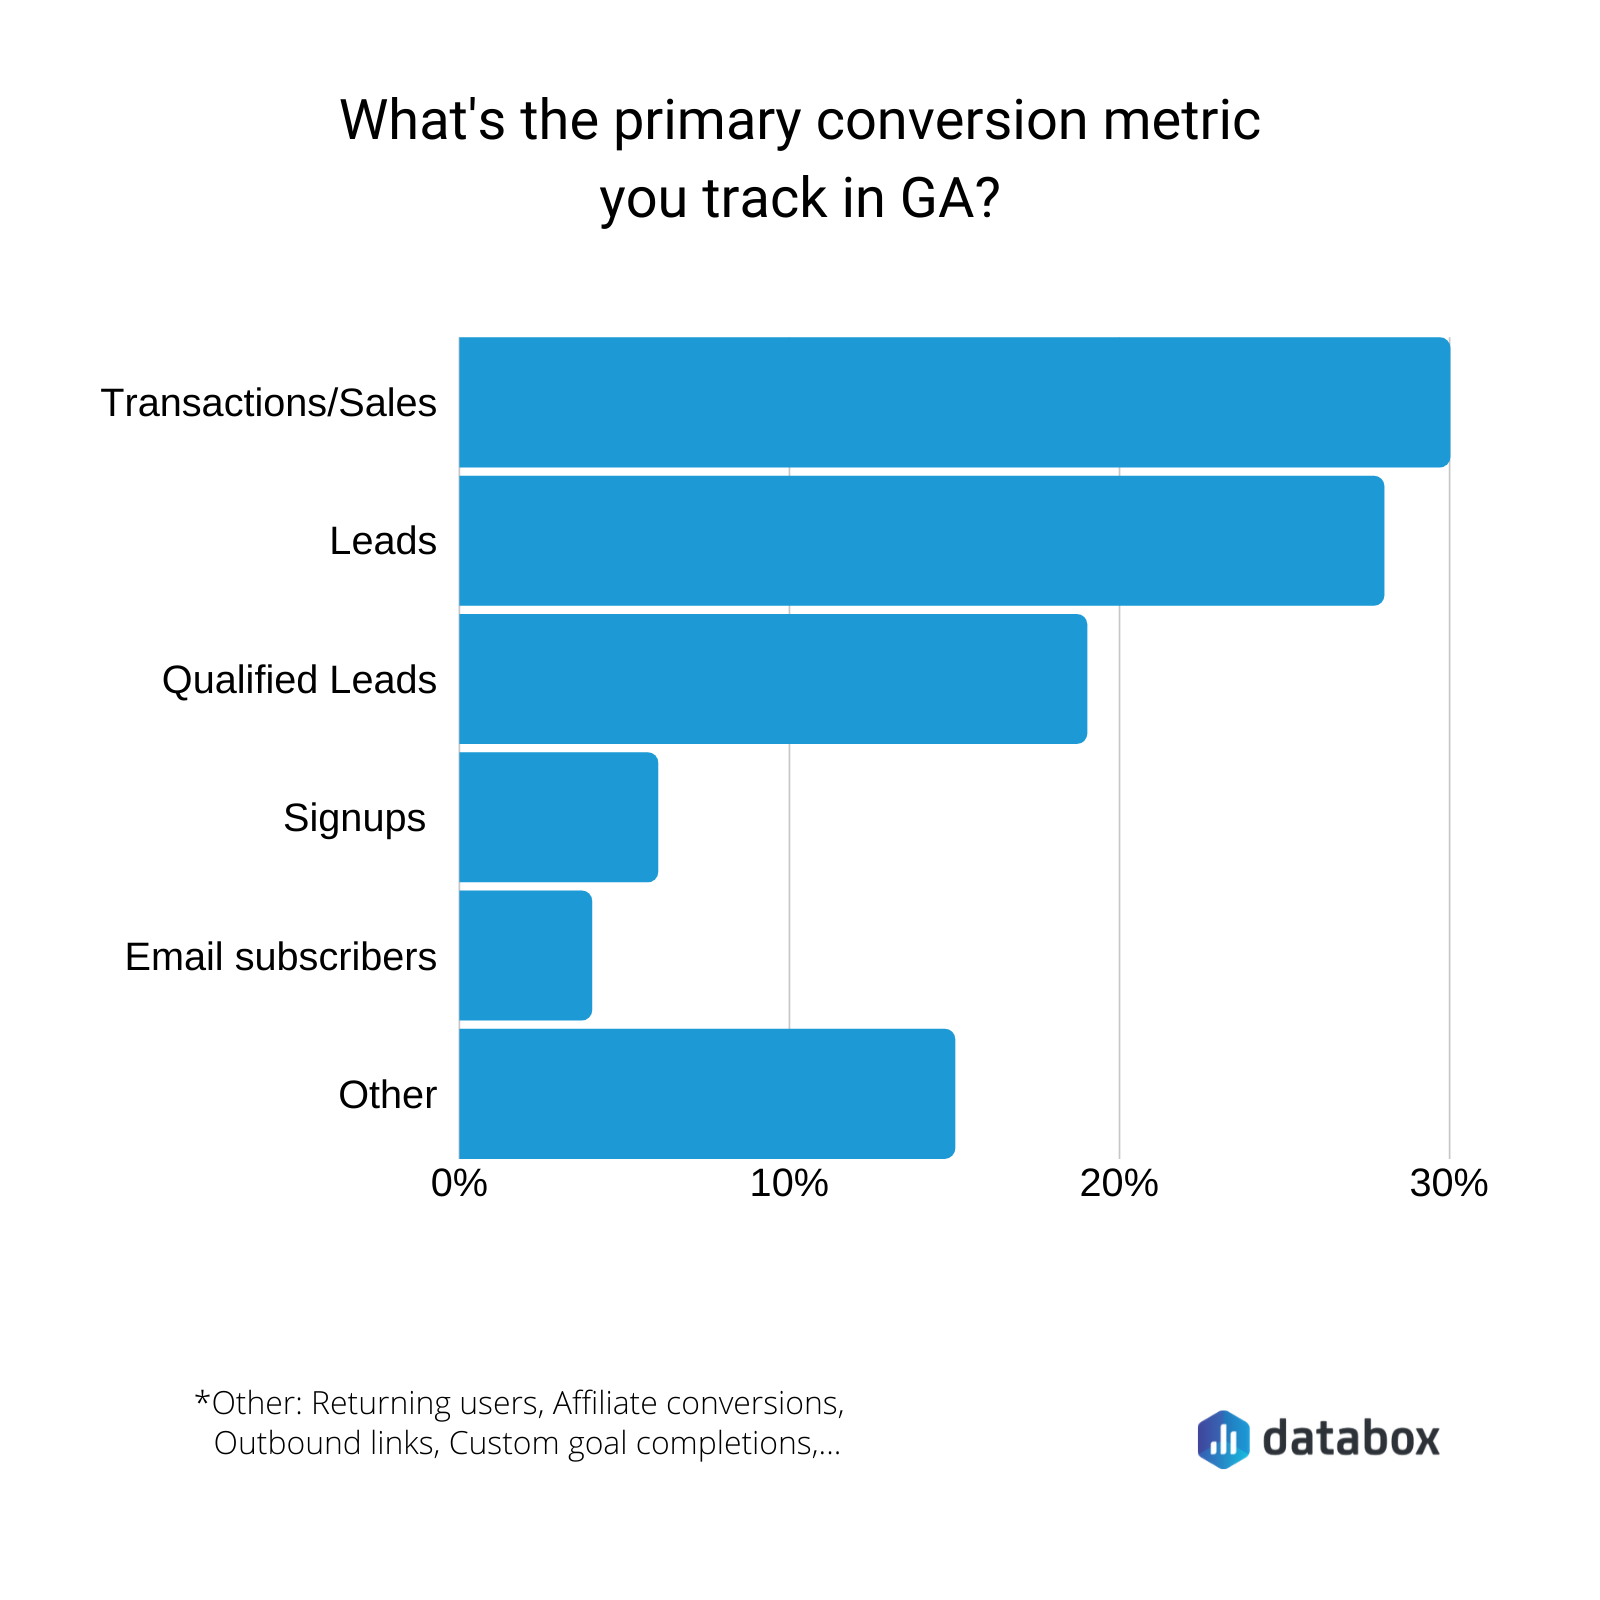
Examining the most common primary conversion metrics
There are no shortages of primary conversion metrics to track in Google Analytics. What you end up tracking and the custom dimensions you use depends on your specific business and marketing goals.
“There is no single dimension that is universal to every organization in analyzing conversions,” says Alan K’necht of K’nechtology Inc.
Nearly 60% of the marketers we surveyed said the primary conversion metric that they look at is either transactions/sales or leads.
For example, you can use custom dimensions to measure the effectiveness of your content marketing efforts.
“One of the ways we use GA Custom Dimensions is to measure the ROI of content marketing,” says Djordje Milicevic of StableWP. “Many of our eCommerce clients use blogging as a way to drive organic traffic and build awareness. Using Custom Dimensions, we can determine the correlation between content engagement and actual sales. This way, we can track and measure the monetary performance of our clients’ content and whether or not it’s successfully driving transaction conversions.”
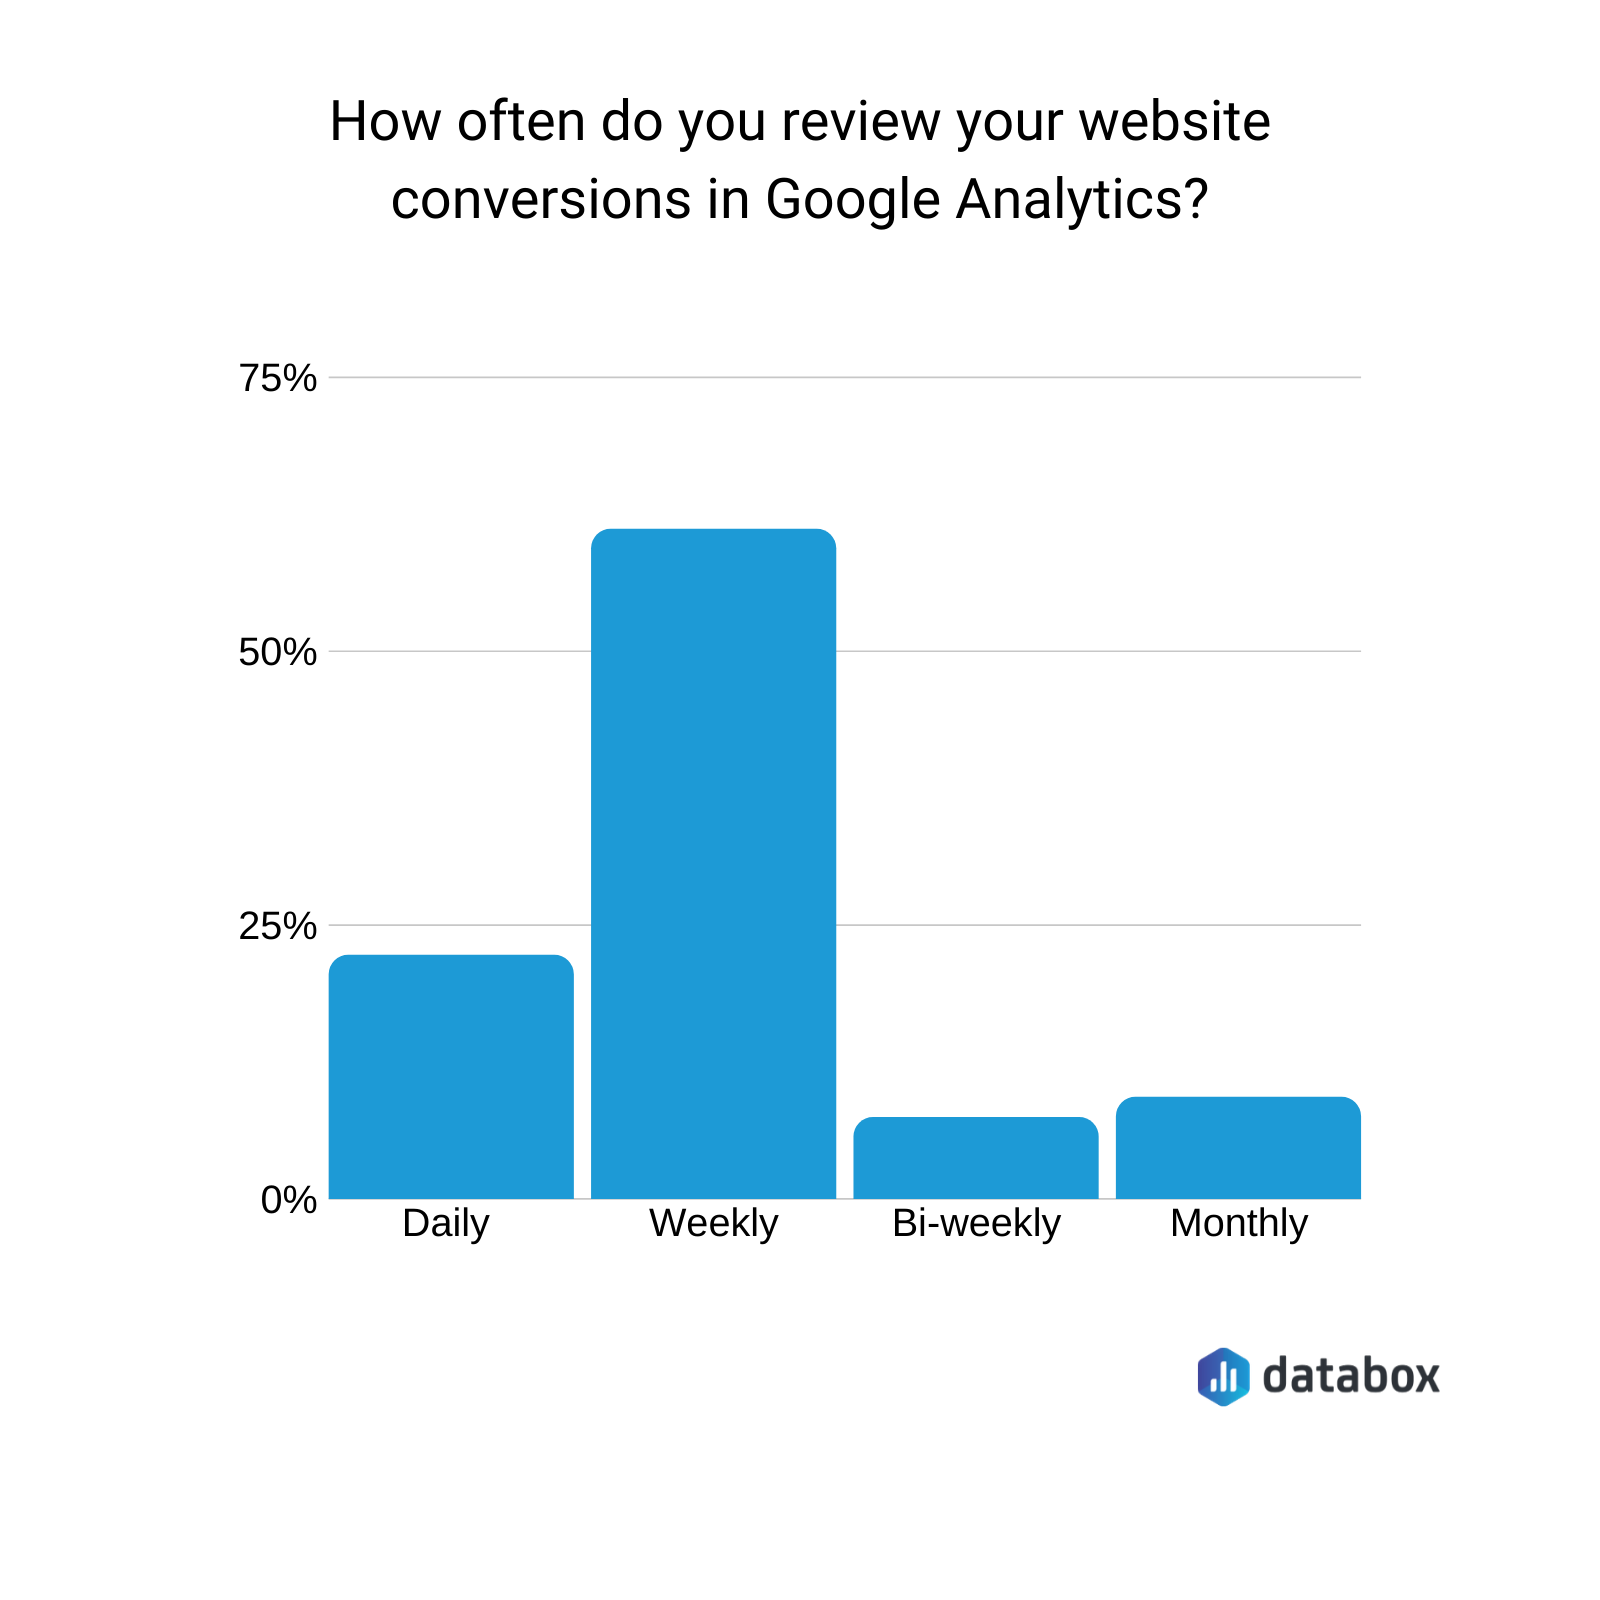
The vast majority of folks we surveyed recommend reviewing this data on either a daily or weekly basis.
1. Channels
Richard O’Connor of First Mats says, “As an eCommerce business owner, one of the most helpful dimensions for me is the “Channels” report under Acquisition. Why? Because it shows me a great overview of where the traffic is coming from and the sales performance in a single table. It’s a great starting point when you want to find out which of your channels is performing the best! With data for average session duration, the bounce rate and conversion rate also included. From this view, you can click on a channel to view a breakdown, including landing pages and campaign names, which is particularly useful for analyzing email marketing and paid advertising campaigns. Each view also includes a line chart covering whatever date range you decide to set (usually last 30 days), which helps to spot sudden increases or decreases in traffic.”
2. Navigation summary
“The most helpful Google Analytics dimension for analyzing conversions is the Navigation Summary,” says Jordan Sizelove of sellmyhousefastcalifornia.com.
“I use it to find out how users get to a specific page on my website. Then I take a look at where they’re clicking. This data is gold! It shows me what’s working on my site.”
3. Acquisition overview
William Taylor of MintResume says, “I’d say the Acquisition Overview section. It enables you to keep an eye on traffic sources such as organic search, direct hits, referrals, and social media, and compare them. It also contains details about the number of sessions, percentage of new sessions, bounce rate, average session duration, and more. It provides you with a bird’s eye view of your traffic sources and how users are engaging with your site.”
Claire Shaner of ZooWho Personal CRM adds, “I love to look at the Acquisition tab in Google Analytics. This helps you understand where your traffic is coming from. Using conversions to analyze this helps you measure the value of each traffic source. For example, if referrals from a certain website or social media platform have a high conversion rate, you can plan to allocate more resources to developing that source.”
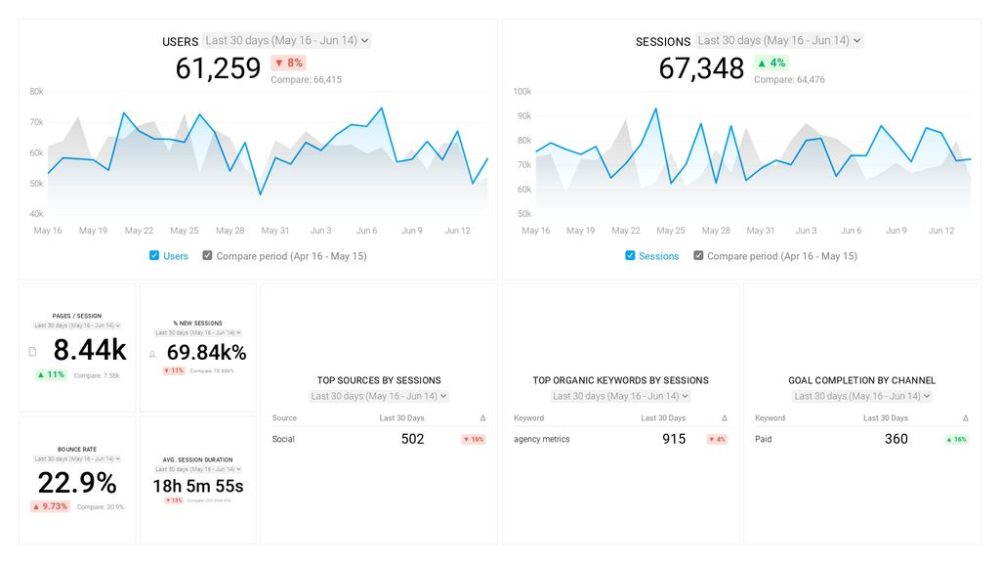
PRO TIP: How to track these 10 popular Google Analytics 4 metrics
Sure, there are dozens (and dozens?) more Google Analytics 4 metrics you could track. But, starting with these 10 commonly tracked metrics will give you a pretty high-level view of how your marketing is working…
- Sessions: The number of sessions can tell you how many times people are returning to your website. Obviously, the higher the better.
- Sessions by organic keyword: Which organic keywords bring in the most traffic to your website? This may help you determine whether your SEO investments are paying off.
- Bounce rate: Do visitors leave shortly after landing on your website? Or do they stick around?
- Average session duration: How much time are people spending on your website? Users with a high average session duration are most likely relevant to your company.
- Goal completions: How many users responded to your call to action?
If you want to track these in Google Analytics, you might find the visualizations limiting. It’s also a bit time-consuming to combine all the metrics you need in one view.
To better understand how your website performs in terms of traffic growth and conversions, we’ve made this plug-and-play dashboard that contains all the essential metrics for understanding how successful you are at optimizing different aspects of your website.
You can easily set it up in just a few clicks – no coding required.
To set up the dashboard, follow these 3 simple steps:
Step 1: Get the template
Step 2: Connect your Google Analytics account with Databox.
Step 3: Watch your dashboard populate in seconds.
4. Source/Medium
“The Source/Medium dimension enables us to segment which sources of traffic are driving results,” says Brett Farmiloe of Markitors. ”For our SEO company, we’re constantly looking at sales and revenue for our eCommerce clients. Source/Medium dimension enables us to see how much revenue can be attributed to organic search versus paid search. This insight allows us to make a critical decision on whether to reduce paid ad spend on keywords that are ranking or increase paid ad spend on keywords that aren’t quite on the first page.”
Alysha Schultz of Intuitive Digital says, “You should always be looking at your conversions by traffic source. This will help you determine what marketing campaigns and work are actually pulling in qualified users who convert.
Are you doing SEO work? You need to know how many conversions are coming in through organic traffic.
Is all that time you’re spending on social media actually bringing in conversions? Don’t overlook assisted conversions and top conversion paths. More touchpoints are needed than ever to convert users, and if you’re not looking at their whole journey and which channels help lead to conversions, you’re just making guesses in the dark.”
Muhammad Ali Sangi of PureVPN says, “The most helpful Google Analytics dimension, which I think will definitely be medium/source for analyzing conversions. I always want to know the source from where I am getting more conversions. Due to the analysis, I got from source/medium. I change my strategies for specific platforms that have so much potential of converting users by these insights not because of the lack of quality in the content or campaign.”
“Although I can’t say this is most helpful to all sites, for ZoomOwl, I analyze the source/medium traffic as well as referral traffic,” says Lenin Nair of ZoomOwl. “When I am doing some campaigns through social media, I try to look at social traffic data as well.”
Simon Nowak of 3 Credit Scores adds, “This helps evaluate the marketing strategy so you can see what’s most effective and where conversions are coming from.”
For example, Dylan Zsigray of Kiwi Creative says, “One of the most common conversions we see on websites is a user filling out a contact form. This simple step elevates the user to a possible lead and indicates their interest in a specific company’s product or service. With contact forms, the best practice is to have the respondent redirected to a thank you page upon submission. This leads to accurate conversion recording based on the page view. One of the most helpful dimensions in Google Analytics is related to this. When we look at analytics from our thank you page in GA; we add Source/Medium as the secondary dimension. This addition shows us how users initially landed on the site, whether from organic search, social media, referrals, etc. Based on this data, we can optimize our marketing strategies to focus on the platforms (e.g., social media) that lead to our highest conversion rates.”
Jill Caren of 2 Dogs Media adds, “For us, one of our favorite ways to analyze conversions is to review the Top Conversion Paths with a secondary dimension for source/medium. This helps us understand if our PPC campaigns are effective and how well we are targeting our users on social and in organic search results.”
“This gives me correlations between conversion rates and the source of the referral plus whether it is a paid or organic one,” adds Michal Czepczor of LiveCareer. “It can give me information about how well my product is optimized in terms of SEO for different search engines. It allows us to track this information and translate it into certain decisions at the level of SEO and SEM. Above all, it is a larger scope which can help us identify problems at different stages of the funnel.”
Ronan Walsh of Digital Trawler says, “Source of the conversion, especially when you put this together with the first click and last click metrics. It’s blown some customers’ minds and really useful for showing the true value you are bringing to a company.”
5. UTM Campaigns
Melanie Musson of 360quoteLLC says, “Campaign tracking – By being able to track a specific campaign, I can then compare the results. Sharing successful reports with my team keeps everyone motivated.”
6. Keywords
“Gender, age, city, source/medium, keywords, device, category, browser, and operating system are all considered as useful dimensions in Google Analytics,” says Rajat Chauhan of TutorEye Inc. “However, the most important to all is the Keywords that one must take into topmost consideration while analyzing conversions.”
7. Bounce rate
The most helpful Google Analytics dimension for analyzing conversions is “Bounce Rate,” says Tarun Gurang of iFour Technolab Private Ltd. “The definition and meaning of the bounce rate is simply the number of single-page sessions (bounces) divided by the total number of sessions. It means how much time users are spending time on your website. Higher the rate of users spending time, higher to get the chances of getting the conversions (Low bounce rate, high rate of success/High bounce rate, low rate of success).”
Tommia Hayes of Community Health Charities says, “This is useful because it shows which content resonates best with audiences. When you click to dive deeper, you learn which content engages your audience to learn more about your company by looking at the bounce rate from that page. If you see certain pages have low traffic and high bounce rates, then it helps to understand which content isn’t going to increase conversion rates. If certain pages have low bounce rates, a good amount of time spent on the page and clicks on links, then that’s the type of content you should create and share more of. This helps convert leads into customers.”
Eric Melillo of COFORGE adds, “Monitoring our bounce rate per blog post, and we can see how well (or not) a piece of content resonates with our web visitors. A higher bounce rate might suggest that we mismatched our content for the search term, misaligned the content type, or our content doesn’t answer the search query. Monitoring of dimensions daily helps us stay connected with what’s important to our target audience.”
8. User Behavior
“Behavior is the most important part of analytics,” says Syed Ali Hasan of Film Jackets. “It is one of the useful dimensions to track how your landing pages are performing, what users are doing after visiting, and how you can improve it. For reporting purposes, we check website landing pages visits, and checkout. We use this to determine whether our products need optimization or any changes.”
Emma Marcotte of Traktek Partners adds, “I use this to see what pages are performing the best, and which are not performing. I then base future blog post topics off the top-performing pages and also drive emails to ones performing well.”
9. Lead generation costs / Cost per conversion
Sophie Mann of Encite International says, “The most helpful Google Analytics dimension for analyzing conversions is Lead Generation Costs (Cost Per Conversion). This is key as it allows us to know our ROAS (return on ad spend) and sees the sources where our advertising dollars are being spent most effectively. We use it in reporting to identify which sources are providing the lowest cost per lead so we can scale what’s working and cut back on what’s not.”
10. Top conversions path
Matt Glodz of Resume Pilots says, “My favorite metric for analyzing conversions is the Top Conversion Paths report (located under Reports – Conversions – Multi-Channel Funnels – Top Conversion Paths). The report shows you whether users who converted initially accessed your site directly or via an organic search, Google Ad, or referral. It also shows you how many times the user returned before making a purchase. We find it extremely helpful in analyzing which visitors are actually converting as well as the profitability of our Google Ads campaigns.”
“The conversions of the website I work for are booking requests, which is long-term and usually pass through different paths before entering our customer system,” adds Lora Georgieva of ProExpo Services. “Therefore, I use the “Top Conversions Paths” metric from the Multi-Channel Funnel drop menu (“Conversions”). After selecting it, I apply a secondary dimension à “Acquisition” -> “Landing Page URL Path,” which allows me to track down the landing pages, through the source parameters. This way, I can directly report to my managers, how did a particular request enter our system.”
11. Goal conversions by channel
Chris Steele of Knowmad Digital Marketing says, “This performance metric is the basis for reporting marketing success. The easiest way to show marketing performance is to show the number of goals completed by the channel that is being targeted. (i.e., Organic, paid, etc.)”
Alexander de Ridder of INKforall adds, “Use Conversion Reports – This section shows you the path your customers take on your website, from the entrance to making a purchase or becoming a lead.”
12. Conversions by page
Joe Balestrino says, “Which pages are driving the most leads? Why bother writing blog content and service pages if you don’t know how well they perform? This also helps to plan future ideas on content.
Don’t look at conversions as a whole because it doesn’t provide you with a full picture. If all leads come from the home page, it is a good indication that leads are coming from those who already know your brand.”
13. Goal completions
The most useful dimensions in Google Analytics that I use to analyze conversions are the goal previous step dimensions,” adds Kyle Mollison of VividFront. “I will take a look at the pages that lead up to conversion to better illuminate the paths that users take to conversion on the site. This lets me see which pages are important to the conversion funnel that could also be optimized.”
Lauren Walter of Search Optimism adds, “When analyzing conversions in Google Analytics, the Goal Completion Location and Goal Previous Step dimensions can be incredibly helpful. Goal Completion Location gives you the URL of the page where a user completed a goal or conversion. Goal Previous Step 1 is the previous page the user visited before converting, Goal Previous Step 2 is the page before that, and Goal Previous Step 3 is the page before that. These dimensions are available in the Reverse Goal Path Report.
These dimensions give you valuable insight into the paths your customers take to complete a goal. You can identify the most popular paths, the highest-converting paths, and critical pages users are visiting shortly before converting. This data allows you to optimize the most important pages in these paths to better suit your goals and also direct more efforts toward bringing prospective customers to these pages.”
14. Attribution
“Attribution tab in Google Analytics is what we use to define conversion path using all channels on our site,” says Rajat Chauhan of TutorEye Inc. “It is based on the Conversion credit model = Last click and Path length ≥ 2 touchpoints. which is easy to represent in the report with specific channels or conversion paths.”
15. Landing page
“My favorite Google Analytics report is looking at free trial signups using the Landing Page dimension,” says Reggie Paquette of Revealbot. “The Landing Page dimension shows the quality of traffic that’s arriving at your site by the first page in a session. We check this report every couple of weeks to see which pages we need to do better at converting traffic or which blog post topics to avoid if they have a low conversion rate.”
Joseph Karasin of POSH Detroit adds, “Because I set up customized campaigns for my clients, I like to focus on the data within the landing page dimension. That way, I can communicate successes or failures to clients in a clear and concise manner.
Mitch Chailland of Canal HR says, “I find it most helpful to use the landing page dimension to understand better which pages visitors land on, whether that’s from organic search, social media, or another specific campaign. This allows us to analyze these landing pages for conversion rates and find ways to increase conversion on blog posts or other content where there are already lots of visitors. This can be done by adding in calls-to-action on the higher-traffic pages.”
16. Top sources per session
“We use top sources per session, top pages by pageview, and overall sessions when reporting on our own site and reporting or for our clients,” says Jenna Levandowski of Figmints Delicious Designs & Creative Marketing LLC. “At Figmints, we implement inbound marketing strategies for our clients, looking at these metrics demonstrates to our team what’s working. It allows us to assess what pages need more attention, where our visitors are coming from, what channels are or are not performing as expected, allowing us to assess how to optimize our campaigns continually.”
17. User type
Joe Flanagan of Tacuna Systems says, “This dimension is divided into new users and returning users, and is paired with a number of users metric.”
“This helps to gauge the number of new or returning visitors to the site,” adds Pratibha Vuppuluri of She Started It. “It helps me get an idea of how healthy the website is.”
18. Per session goal value
Adam Ford of Rattling Tram Small Business & Retail Marketing says, “This is a core metric for comparing the comparative performance of all your traffic streams.”
19. Sessions to transactions
“Sessions to transactions dimension is the difference in the number of sessions between entering a given campaign and the transaction,” says Krzysztof Surowiecki of Hexe Data. “We use it for our customers because it shows the effect associated with how many inputs the user needs to make a purchase. We can estimate here how much work we need for the user to buy. Thanks to this information, we can optimize the purchase process.”
20. User IDs
“User IDs: We collect User IDs from website visitors and push it into our CRMs with form fills on the website,” says Oeuyown Kim of Portent. “Leads are qualified within the CRM, and that lead status is integrated with our website data in Google Analytics to attribute MQLs to campaigns and sources.”
21. Page value
“Page value has really helped me to identify key pages that users visit prior to completing a conversion,” says Craig Streaman of Streaman Marketing.
David Silverman of Solution Loans adds, “We track conversion values and so you can see which entrance pages are your money pages allowing you to optimize your internal page rank to point to those as well as showing pages that could be improved.”
22. Event label
“The most helpful Google Analytics dimensions for us are the Event label and Event category,” says Faizan Ali of WPBeginner.”It tells us about the number of referrals we have sent to our affiliates. This helps us keep track of the performance of all the affiliates and helps us make our decision on which affiliate to focus on in the future. We couple this with the landing pages dimensions as this gives us an idea about which page is sending the most traffic to our affiliates.”
23. eCommerce conversion rate
“If tracking revenue is your conversion goal, then the eCommerce conversion rate can be very helpful (you can check this in the conversion section of google analytics),” says Sanya Aru of MakeWebBetter. “eCommerce conversion rate is the dimension that analyzes the traffic and data from all your traffic sources and mediums to provide the exact percentage of revenue earned.
24. Author
Isabella Federico of Webizz adds, “For example, if you run an inbound strategy with a blog and your blog is written by different authors, you may like to know which author leads to more conversions. You can extrapolate this data with a custom dimension (assigning an author to his pages in your blog).”
25. Demographics
“Customer persona is the most helpful Google Analytics dimension for analyzing conversions,” says Avinash Chandra of BrandLoom. “Amongst the people who are actually converting, we try to identify their persona so that we can build our targeting for our paid methods. So demographic dimensions are the most important Google Analytics dimensions, which helps us to increase our conversions.”
In conclusion, whether you are measuring new leads, sales, or free trial signups, these are 25 custom dimensions you can use to understand what’s leading to the most conversions on your site.