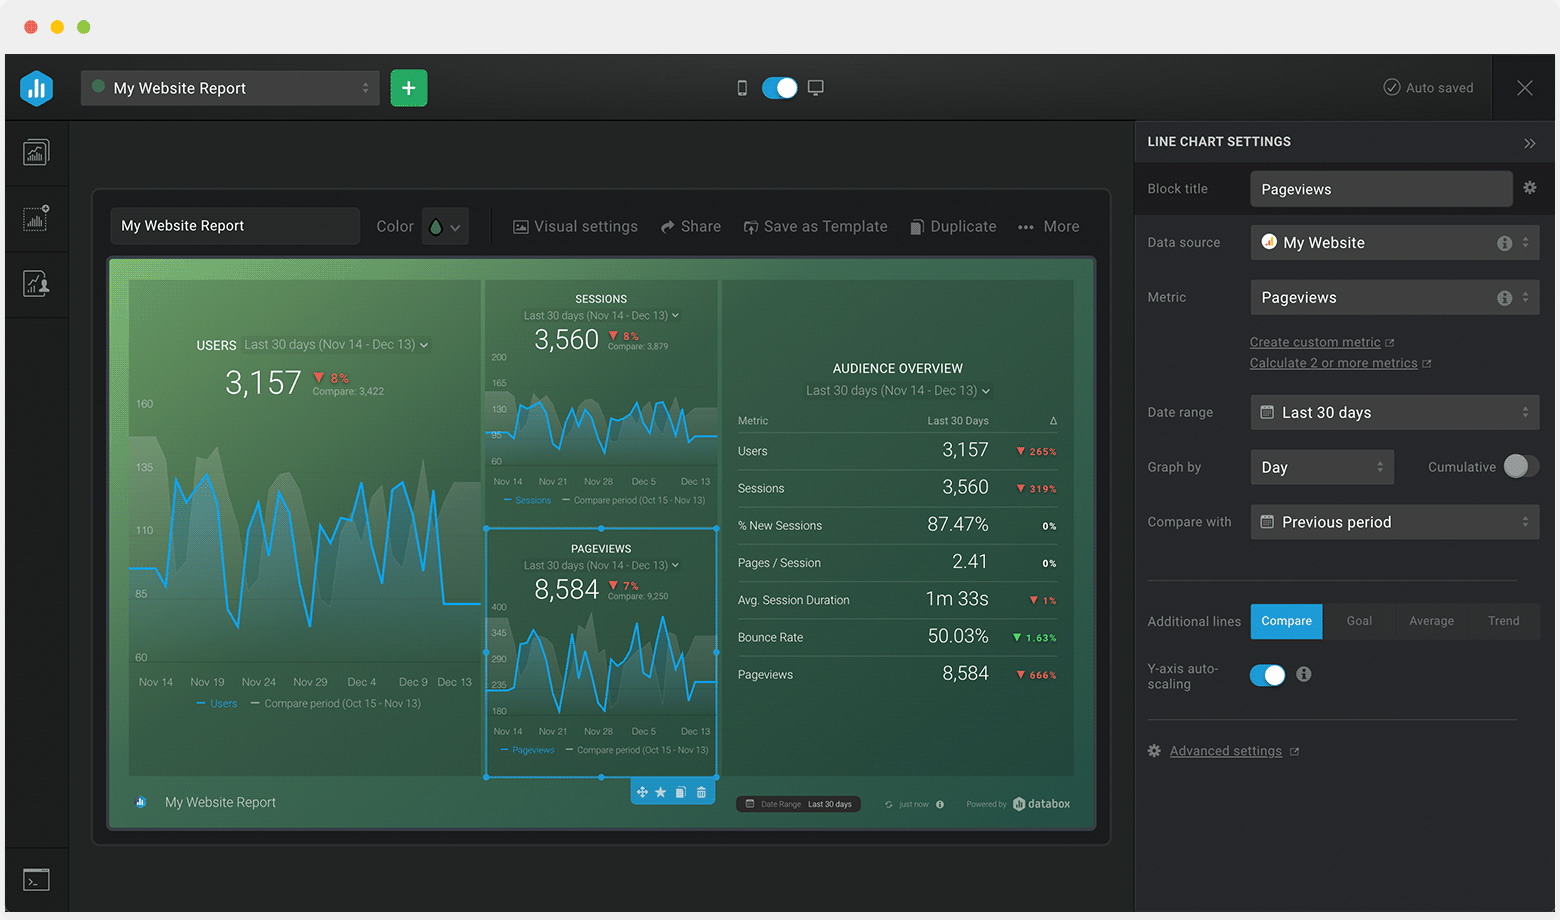
SEO Campaign Performance Dashboard Template

Template created by Marketing Media Cloud Marketing Media Cloud
Use this free SEO Campaign Performance Dashboard Template to measure your SEO Campaign’s success in terms of clicks, users, channel sessions, and devices. Measure the impact of your SEO strategy and quickly identify what’s working and what isn't.

Uses one-click integrations:

  • Google Universal Analytics Google Universal Analytics
  • Google Search Console Google Search Console

If you don’t use Google Universal Analytics or Google Search Console, you can pull data from any of our 100+ one-click, native integrations or from spreadsheets, databases and other APIs.

Get this dashboard for free

What you’ll learn from this SEO Campaign Performance Dashboard Template:

By connecting your Google Universal Analytics and Google Search Console accounts, you’ll learn:

  • How do I track clicks on my website? Track the number of clicks on your website URLs from a Google Search results page daily. The number of clicks your website receives gives you an overall view of how well your website ranks in Google SERPs and if your website copy is compelling enough and targeted at the right people.
  • Are my website visitors converting? See how many users complete the desired action on your website within a selected timeframe, such as making a purchase, filling a website form, signing up for a service, downloading an ebook, etc. Goal completions are a crucial metric to track for measuring your website’s effectiveness in growing your business. Suppose your site’s goal completion rate remains consistently low over a period of time. In that case, you can combat that by analyzing your best-performing web pages to learn why they are performing better and, after that implementing your learnings in your underperforming web pages.
  • How many users visited my website last month? Visually monitor the number of visitors to your website daily, weekly, or monthly. It is essential to track your website’s traffic statistics to gauge your marketing efforts’ effectiveness and see what needs to be improved.
  • Which channel generates the most traffic? Track and compare the amount of traffic each channel drives to your website daily. By tracking traffic from (paid search, organic search, direct, display, referral, social media, and so on), you’ll be able to determine the most lucrative channel sources to focus on to boost your business.
  • What devices do most of the clicks on my website come from? See what browsers and devices users use when clicking on your website’s URL. Use this data to determine what devices to better optimize for to drive more clicks to your website.
  • How do my web pages rank in search results? Track the SEO position of your website or web pages for specific keywords daily. You can monitor and report on possible improvements or declines for all web pages you’re tracking in real-time. This data lets you know if your SEO efforts are paying off or if your strategy needs reviewing.

Pull additional data using our deep integration with Google Universal Analytics.

What else can you track and visualize with our deep integration with Google Universal Analytics? When it comes to attributing your to traffic and conversions, almost anything:

  • Website traffic and conversions
  • Traffic and lead demographics
  • Social media engagement
  • Paid advertising
  • Landing page performance
  • Campaign performance using custom events

There are many, many different metrics and metric combinations you can track using Google Universal Analytics. And in Databox, you can quickly visualize 100s of Google Universal Analytics metrics in a variety of different ways.

Read more about Databox’s Google Universal Analytics integration.


Pull additional data using our deep integration with Google Search Console.

What else can you track and visualize with our integration with Google Search Console?

  • Impressions clicks, and click-through rate (CTR) by page, search query, and more
  • Impressions, clicks, and CTR by country, device, and search type
  • Average search position
  • Positions by pages and queries
  • Number of queries on position, and more

There are hundreds of metrics you can track using Google Search Console. In Databox, you can quickly visualize your most important Google Search Console metrics in various ways.

Read more about Databox’s Google Search Console integration.

Google Universal Analytics Google Universal Analytics metrics included in this template
  • Sessions

  • Users

  • Goal Completions

  • Sessions by Channel

Google Search Console Google Search Console metrics included in this template
  • Clicks by Devices

    Number of Clicks from a Google Search Results Page that landed the User on your Site during the specified Date Range split up by Devices.

Customize dashboard
Explore all of Databox’s functionalities:

Customize this dashboard with Databox

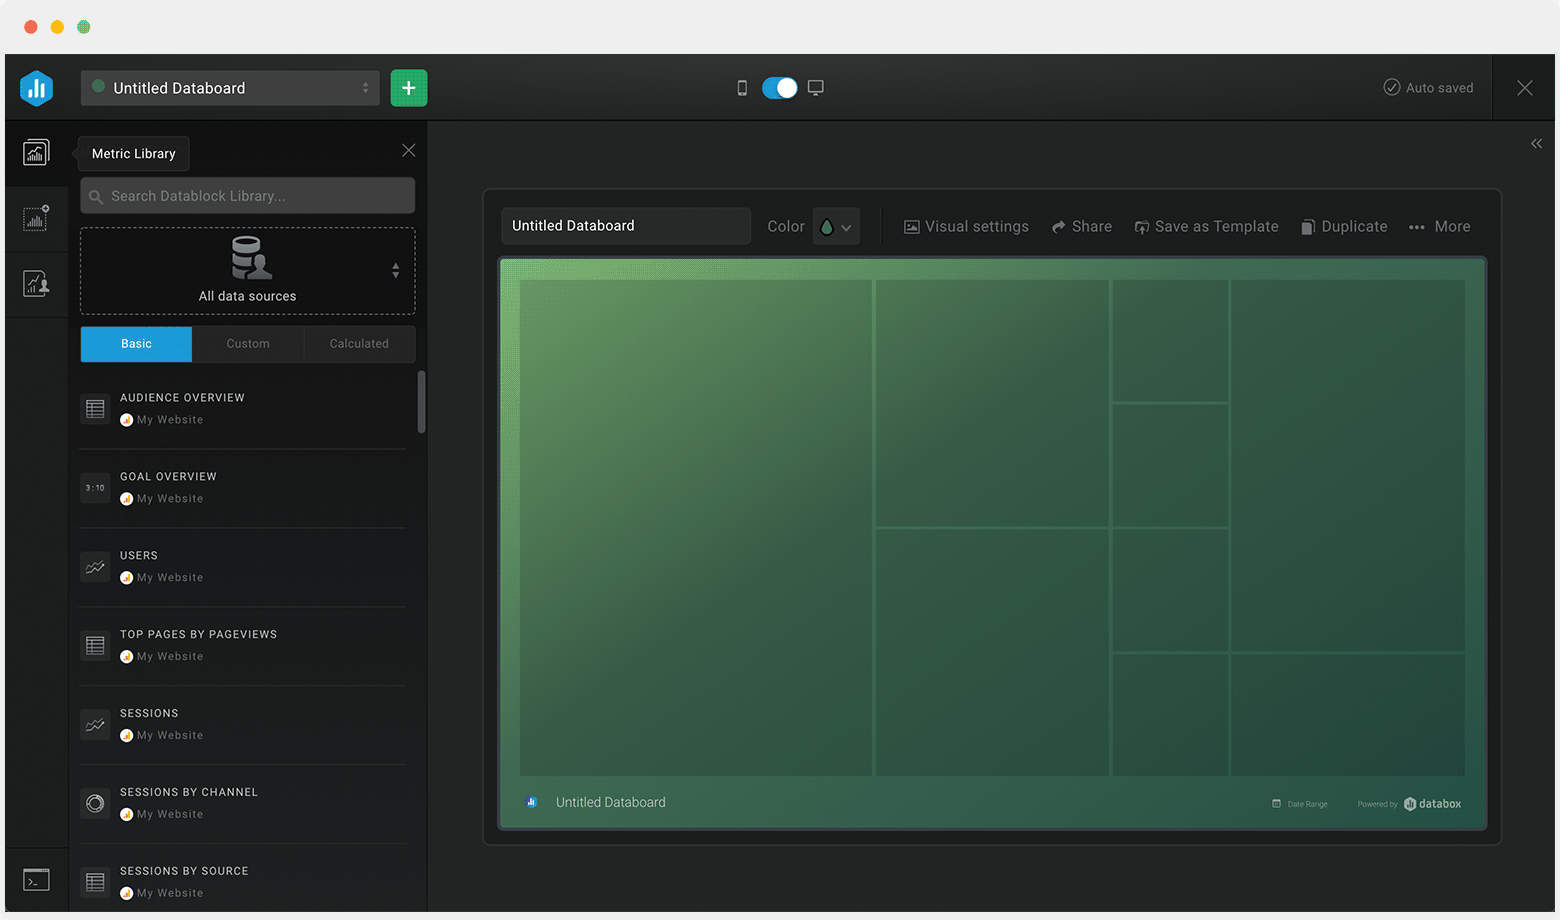
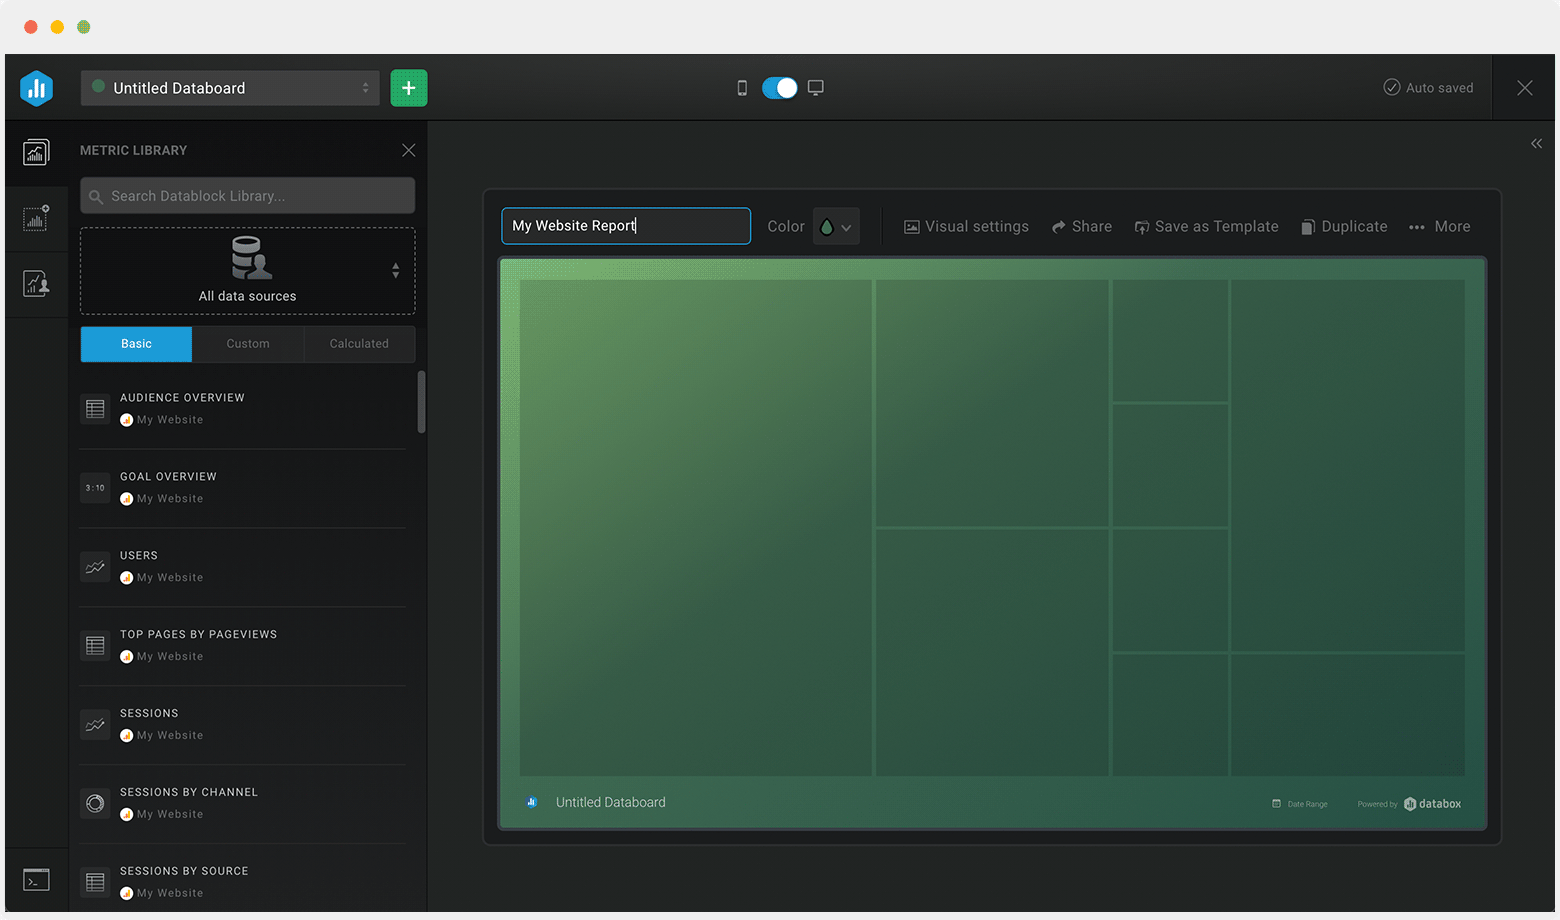
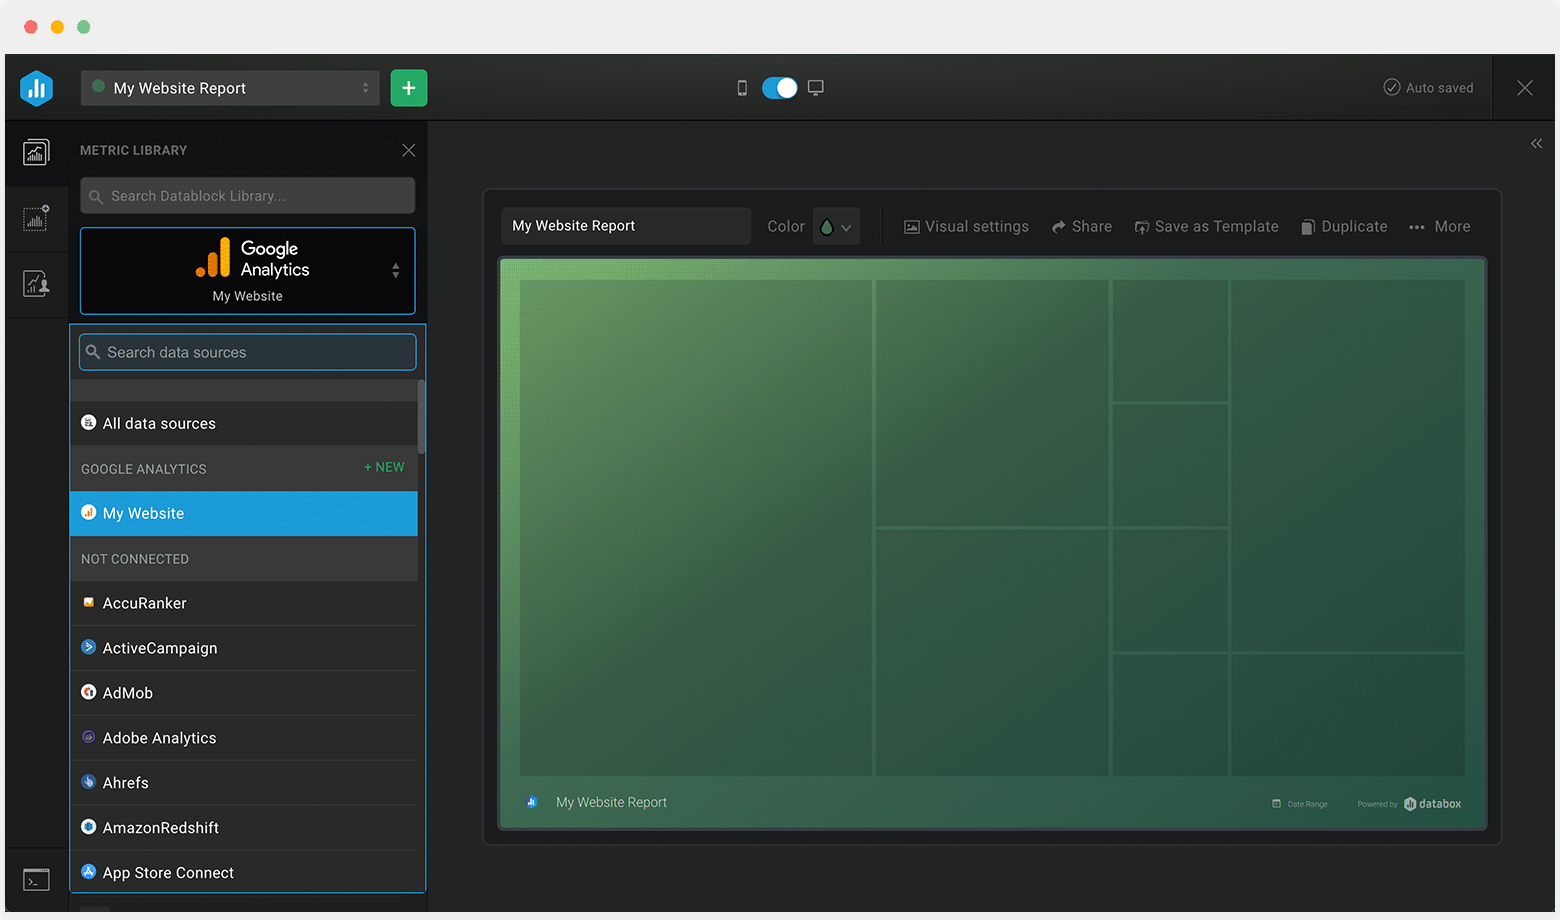
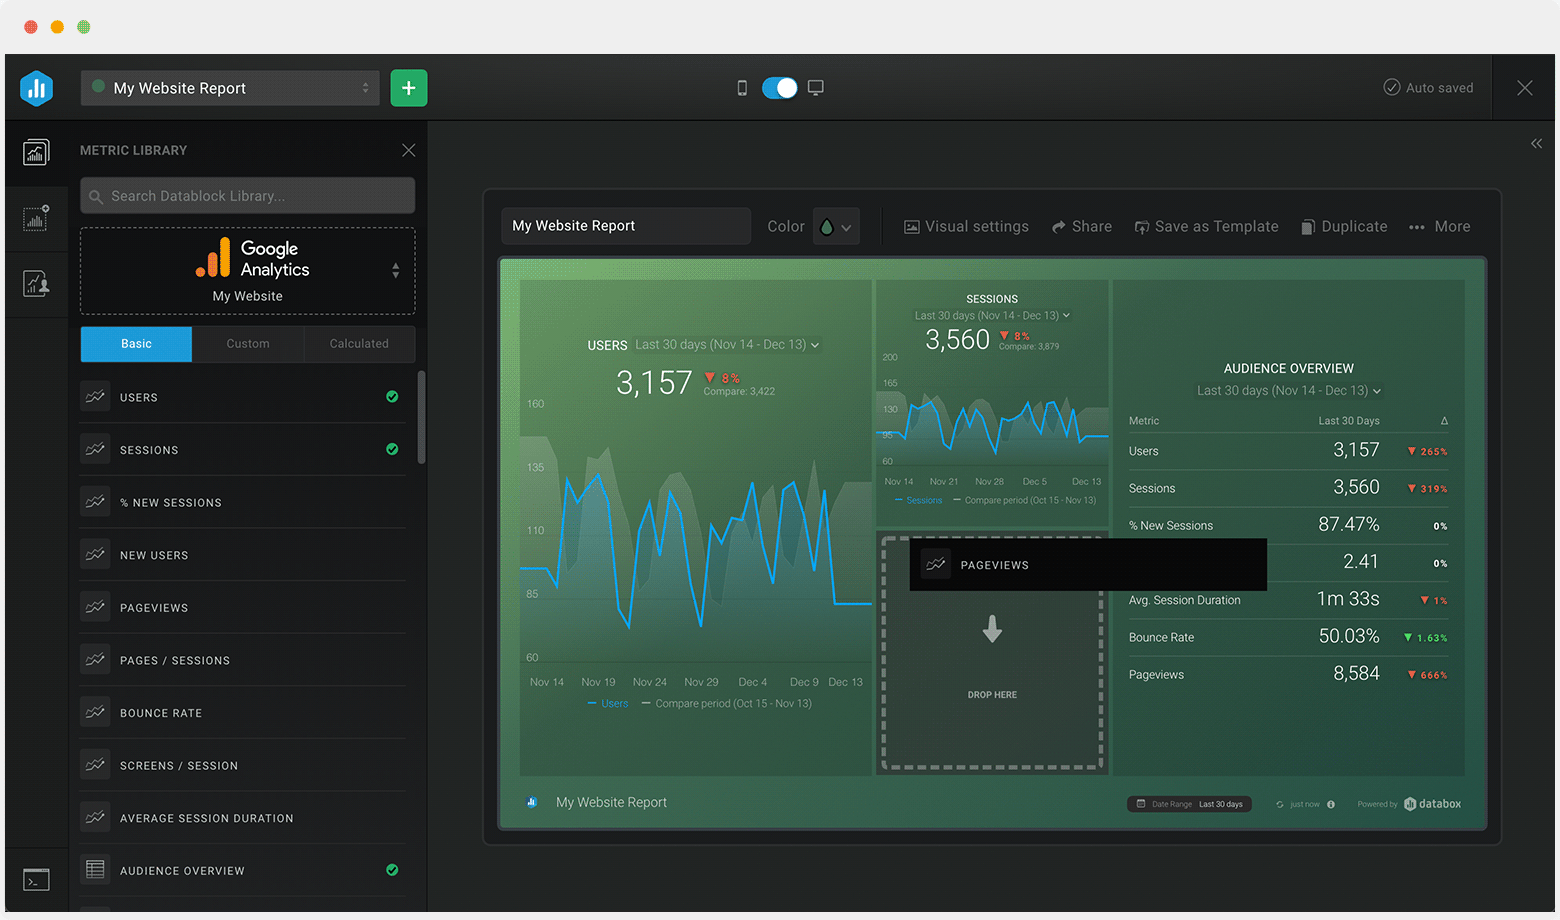
Sometimes, you’ll want to dive deeper into performance. When you need to customize this template (or any other dashboard) to include different metrics, add metrics from different sources, etc., you can do so by using Databox’s Dashboard Designer.

The Designer allows you to easily drag-and-drop metrics and visualizations from any data source right into your dashboard.

Get Started