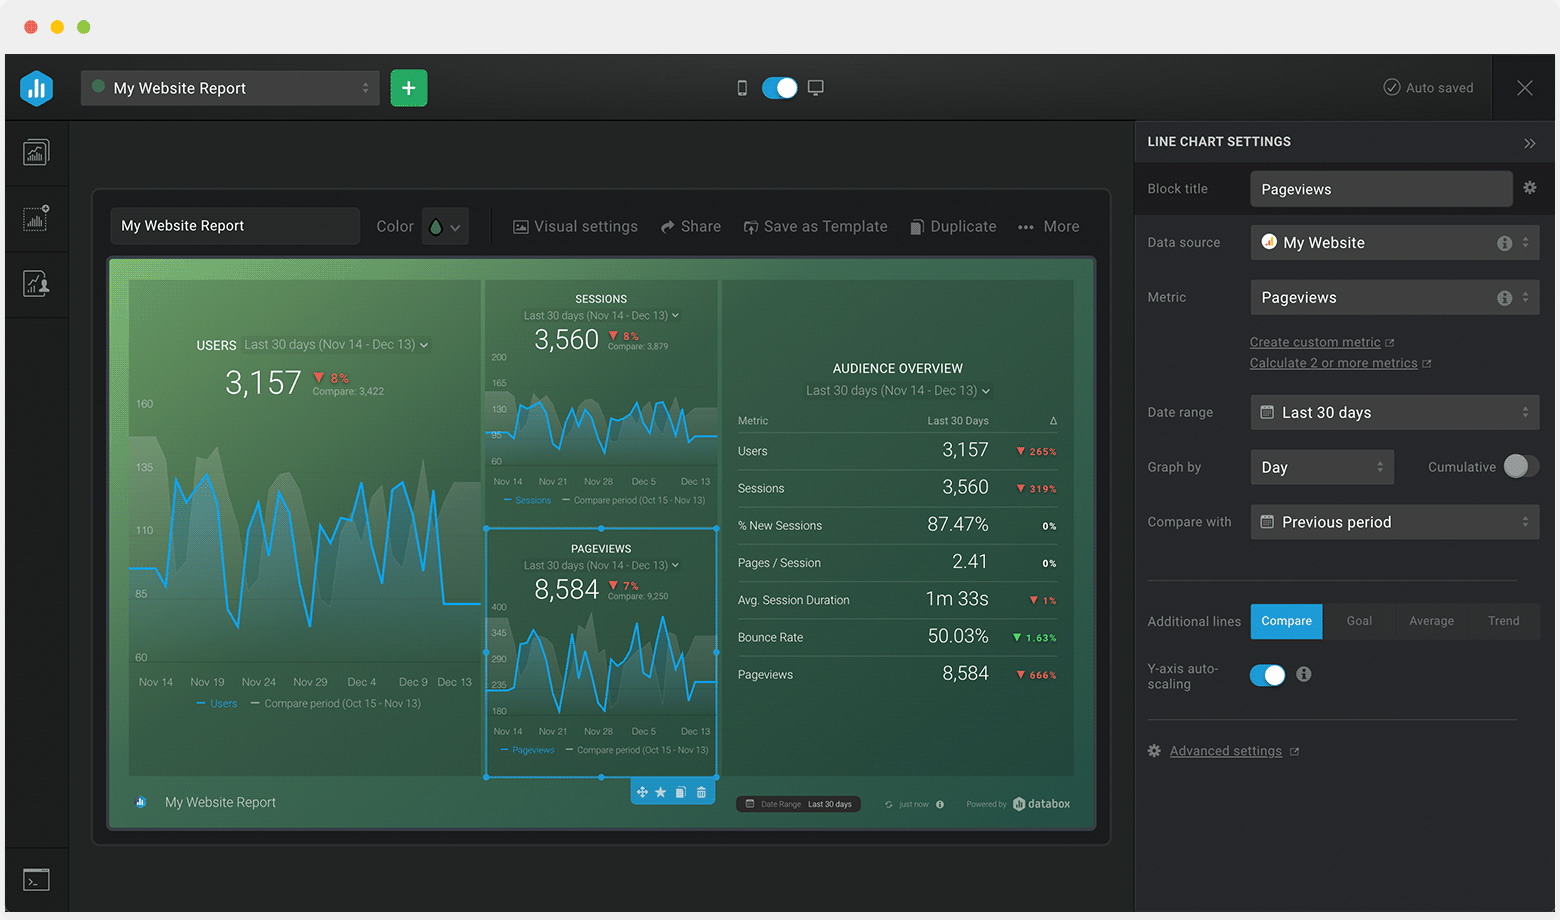
Blog Traffic Distribution Dashboard Template

Template created by Databox Databox
Use this free, easy-to-use Blog Traffic Distribution Dashboard to identify your best-performing articles in organic search and learn how much traffic they drive to your website.

Uses one-click integrations:

  • Google Analytics Google Analytics
  • SEMrush SEMrush

If you don’t use Google Analytics or SEMrush, you can pull data from any of our 70+ one-click, native integrations or from spreadsheets, databases and other APIs.

Get this dashboard for free

What you’ll learn from this Blog Traffic Distribution Dashboard Template:

    • Which keywords drive the most traffic? Track and visualize your website's ranking position in search results for target keywords within a specified time period.
    • Which blog posts drive the majority of your traffic? Find out which specific blog posts generate most of your organic traffic (i.e., see how much traffic each post drives and the total amount of blog sessions they all generate within a given time period). To improve your least performing blog articles, it helps to dig deeper to learn why those posts performing well are doing so. Could it be as a result of the topics? Keywords used? CTAs? Blog length and so on.
    • How do I track my organic search traffic? Track and analyze visits from search engines within a specified date range. Spot and uncover trends or patterns in the amount of traffic your site receives from organic search. Did a sudden drop in traffic occur? Dig in to learn why.

Pull additional data using our SEMrush integration

What other campaign metrics can you track and visualize with SEMrush?

  • Visibility trend
  • Keyword rankings
  • Estimated traffic
  • Site errors and warnings
  • Incoming internal links
  • Competitor intelligence and more

There are many different metrics and metric combinations you can track using these integrations. And in Databox, you can quickly visualize dozens of SEMrush metrics in a variety of different ways.

Read more about Databox’s SEMrush integration.


Pull additional data using our Google Analytics.

What else can you track and visualize with our deep integration with Google Analytics? When it comes to attributing your traffic and conversions, almost anything:

  • Website traffic and conversions
  • Traffic and lead demographics
  • Social media engagement
  • Paid advertising
  • Landing page performance
  • Campaign performance using custom events

There are numerous metrics and metric combinations you can track using Google Analytics. In Databox, you can quickly visualize 100s of Google Analytics metrics in various ways.

Read more about Databox’s Google Analytics integration..

Google Analytics Google Analytics metrics included in this template
  • Blog Sessions, Organic

SEMrush SEMrush metrics included in this template
Customize dashboard
Explore all of Databox’s functionalities:

Customize this dashboard with Databox

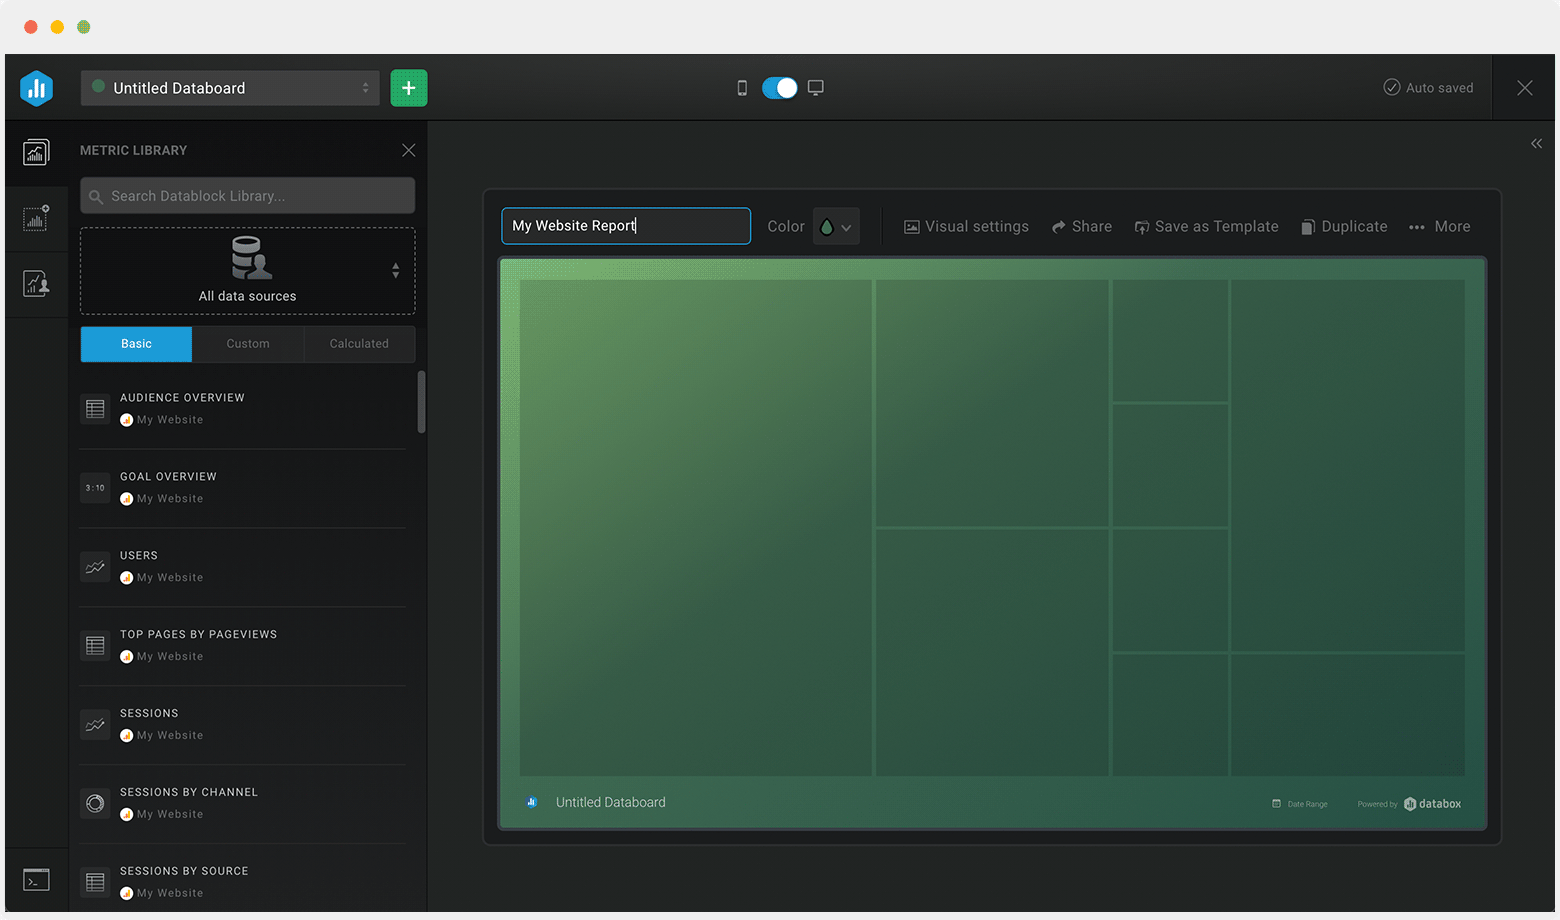
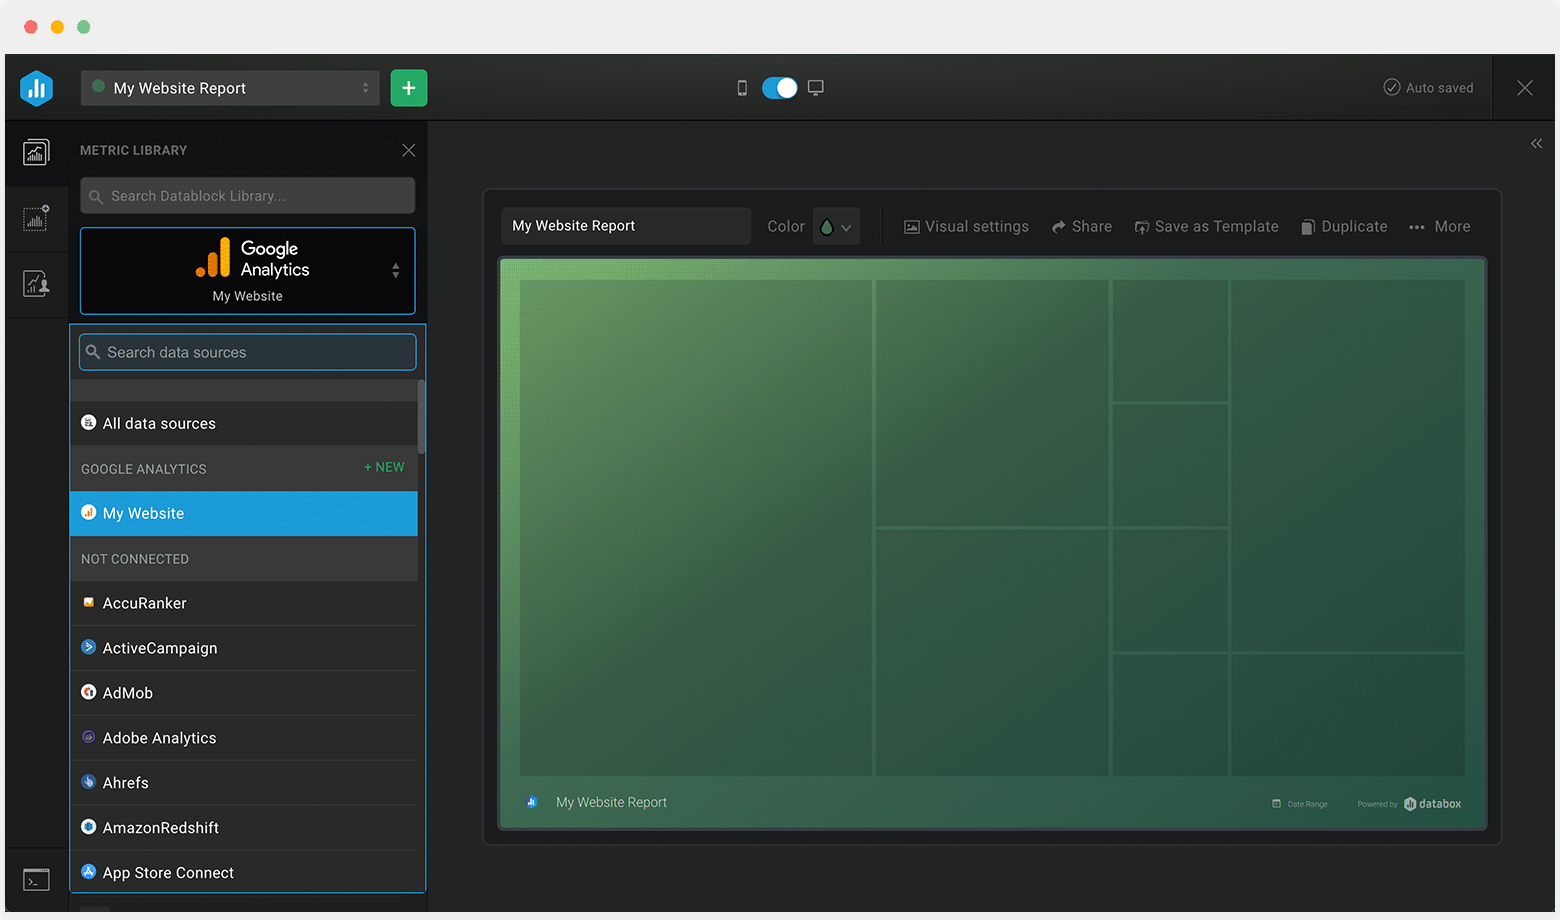
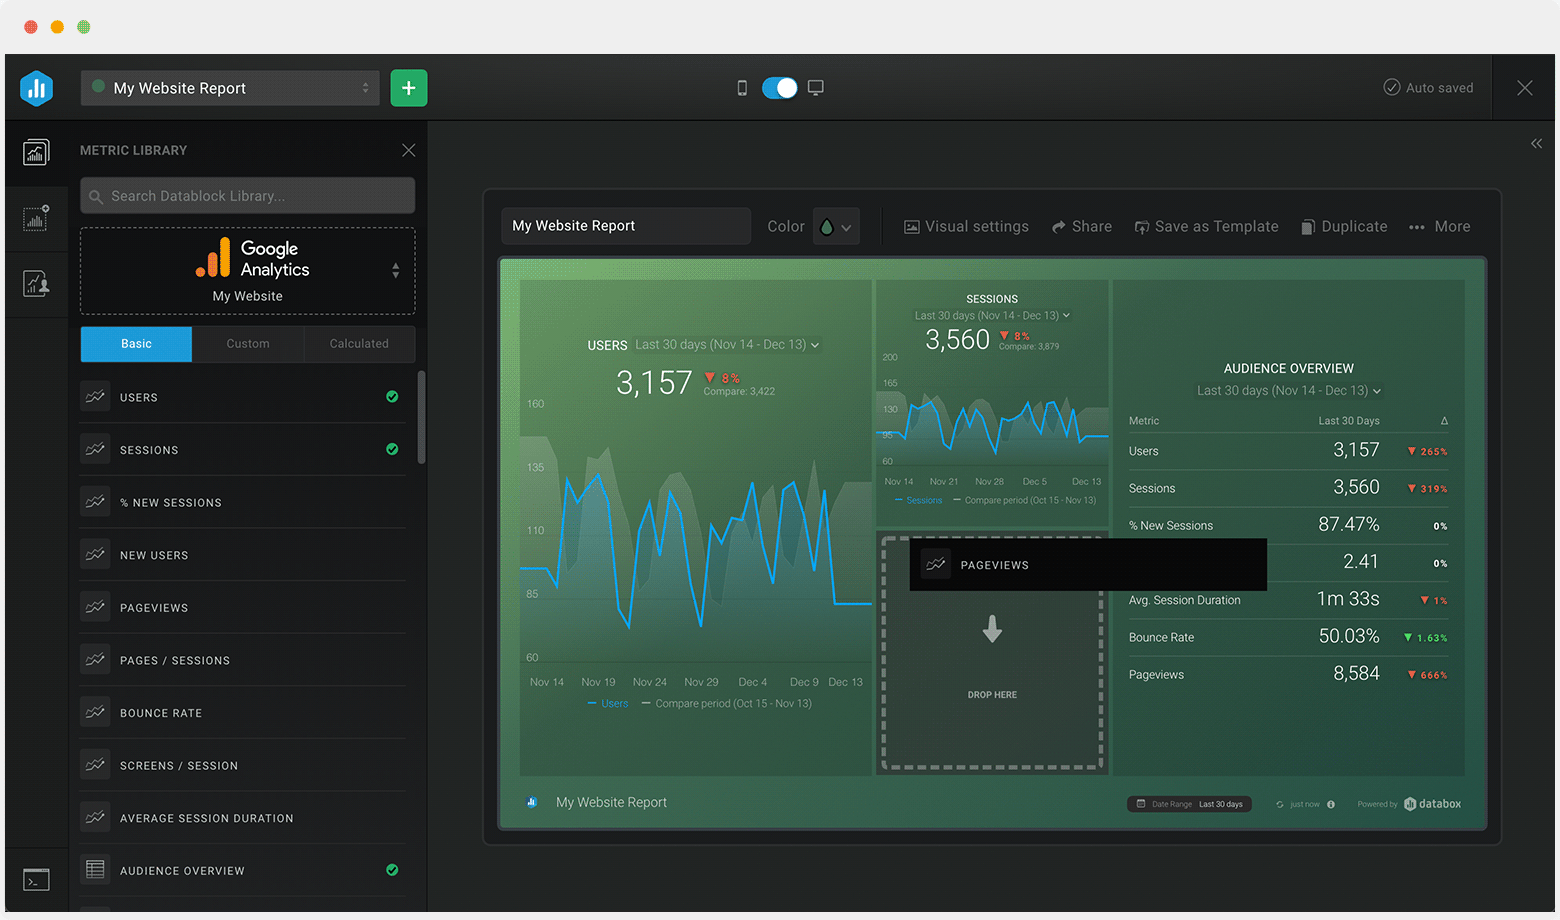
Sometimes, you’ll want to dive deeper into performance. When you need to customize this template (or any other dashboard) to include different metrics, add metrics from different sources, etc., you can do so by using Databox’s Dashboard Designer.

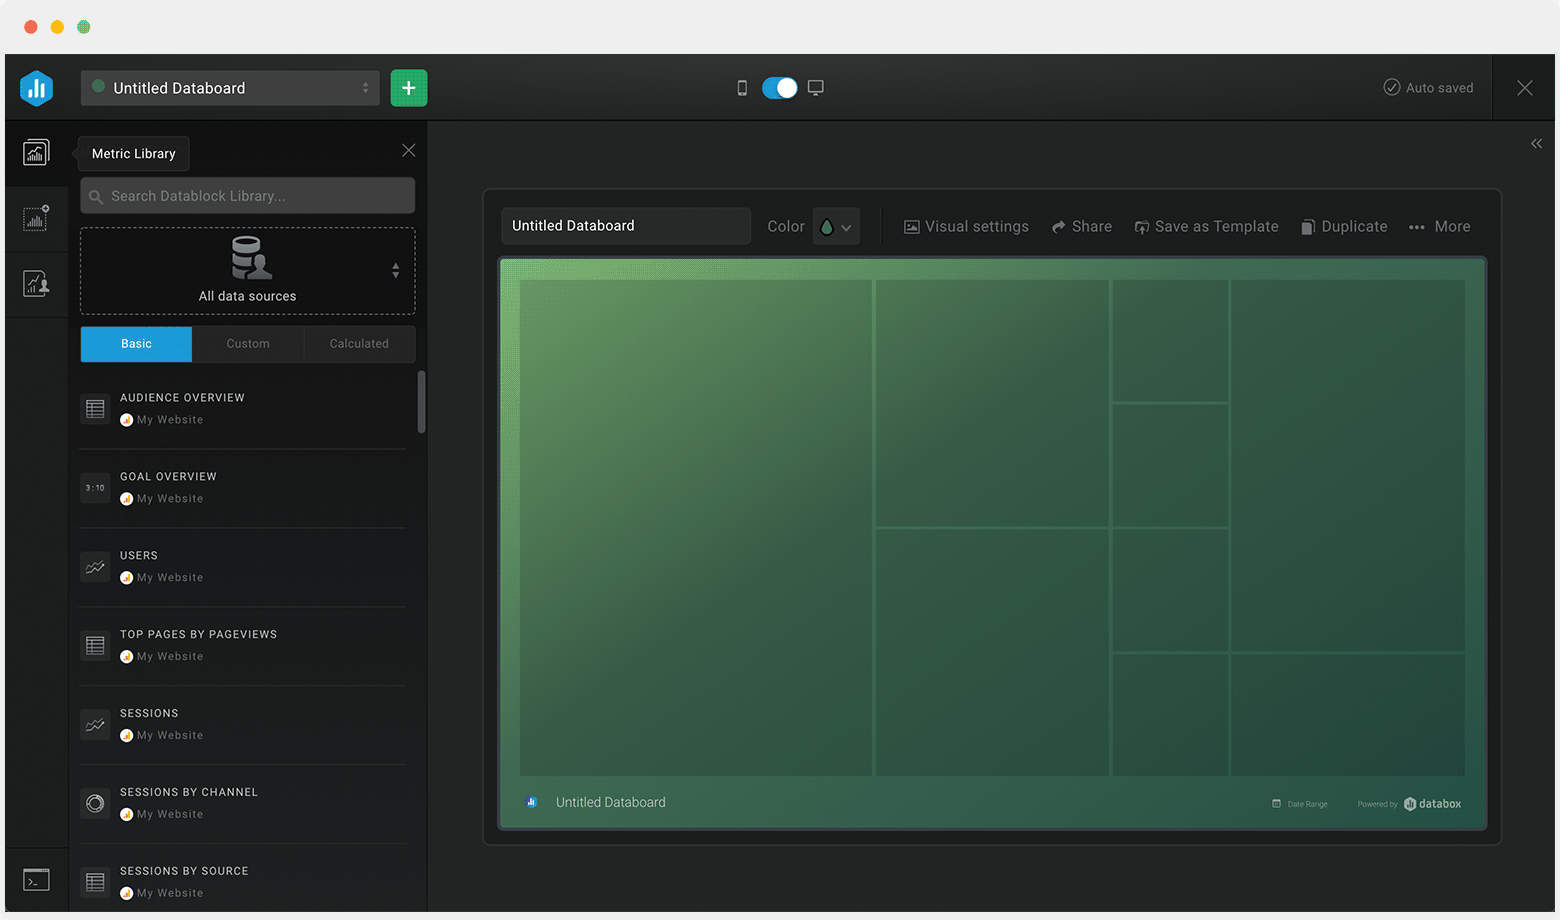
The Designer allows you to easily drag-and-drop metrics and visualizations from any data source right into your dashboard.

Get Started