If you don’t use Google Analytics, Facebook Ads, Google Ads or Mailchimp, you can pull data from any of our 70+ one-click, native integrations or from spreadsheets, databases and other APIs.
By connecting your Google Analytics, Google Ads, Facebook Ads, and Mailchimp account, you’ll learn:
What else can you track and visualize with our deep integration with Google Analytics? When it comes to attributing your to traffic and conversions, almost anything:
There are many, many different metrics and metric combinations you can track using Google Analytics. And in Databox, you can quickly visualize 100s of Google Analytics metrics in a variety of different ways.
Read more about Databox’s Google Analytics integration.
What key metrics can you track and visualize with our integration with Mailchimp? When it comes to your email marketing data, almost anything:
There are many, many different metrics and metric combinations you can track using Mailchimp. And in Databox, you can quickly visualize dozens of metrics in a variety of different ways.
Read more about Databox’s Mailchimp integration.
What other useful paid social metrics else can you track and visualize using our integrations with Facebook Ads and Google Ads? Almost anything:
There are numerous metrics and metric combinations you can track using Google Ads and Facebook Ads. And in Databox, you can quickly visualize dozens of these metrics in a variety of ways.
Read more about Databox’s Google Ads and Facebook Ads integration.
Average Value of transactions during specified Date Range.
Percentage of Sessions that resulted in an Ecommerce Transaction during specified Date Range.
Revenue from Web Ecommerce or In-app Transactions during specified Date Range. Depending on your implementation, this can include Tax and Shipping.
Revenue from Web Ecommerce or In-app Transactions during specified Date Range split up by Channels.
Revenue from Individual Product Sales during specified Date Range split up by Product Name.
Number of Sessions during specified Date Range. A session is the period time a user is actively engaged with your website, app, etc.
Average Cost for 1,000 Impressions during the specified Date Range.
Number of Purchase Events attributed to your Ads during the specified Date Range.
Estimated Amount of Money you've Spent on your Campaigns, Ad set or Ad during the specified Date Range.
Sum of your Cost-per-click (CPC) Spend and Cost-per-thousand Impressions (CPM) Spend during the specified Date Range.
Cost divided by your Conversions during the specified Date Range. Cost includes cost for Interactions that can lead to a Conversion, and Conversions includes only those Conversion Actions that you've chosen to include.
Number of New Subscribed Contacts during the specified Date Range. Mailchimp does not provide net values for this metric directly via their API. We calculate this metric by subtracting the current value from the previous value to determine net change. We recommend displaying this metric on a line or bar chart to view daily fluctuations.
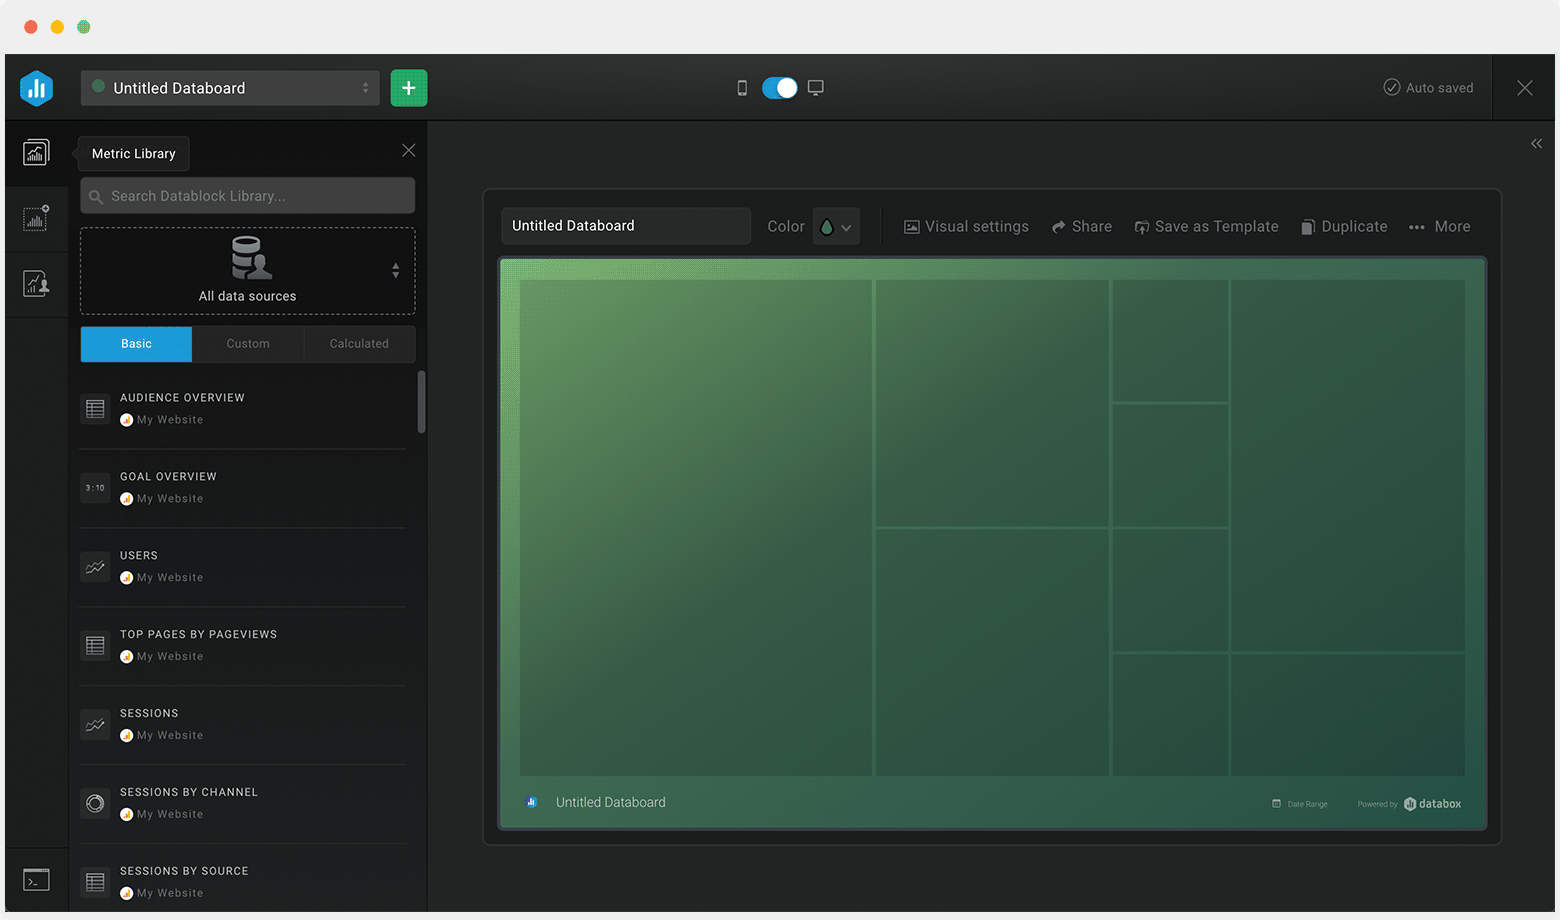
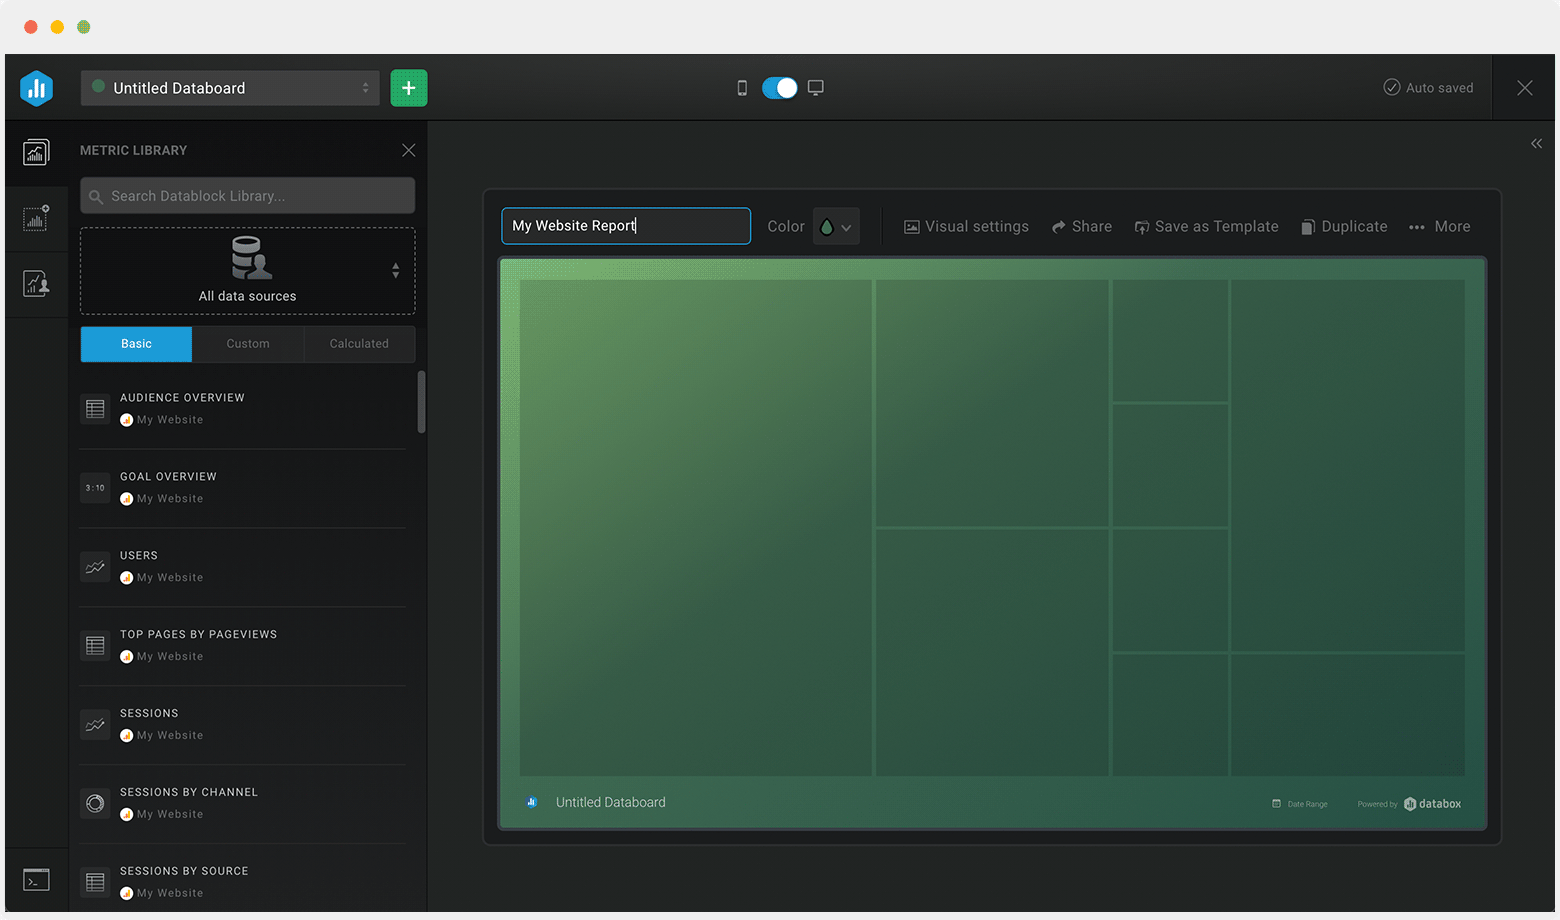
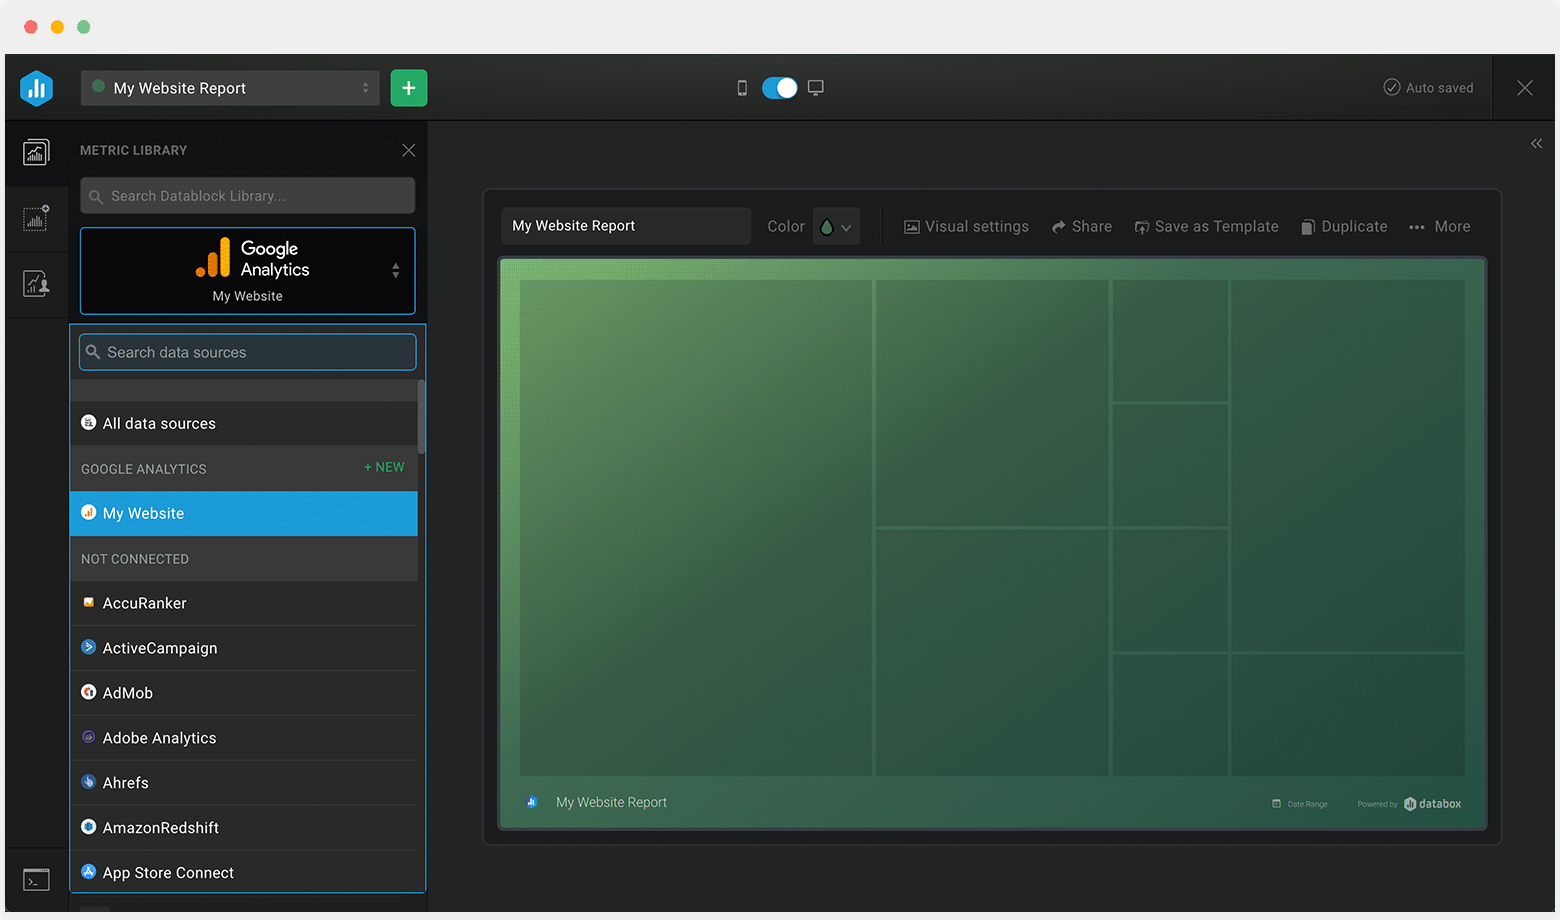
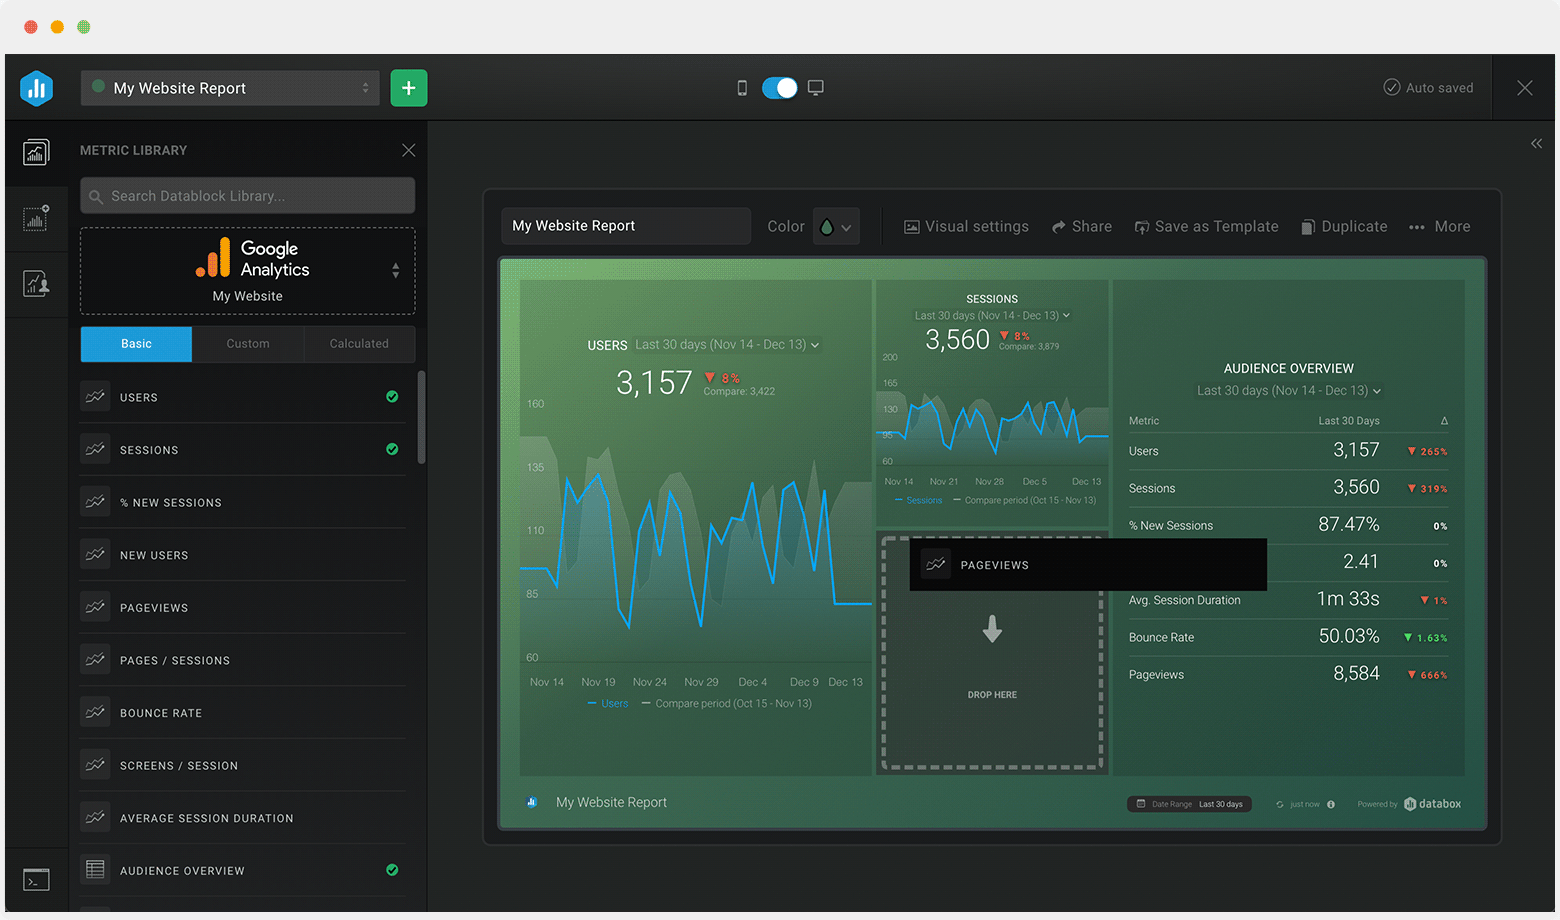
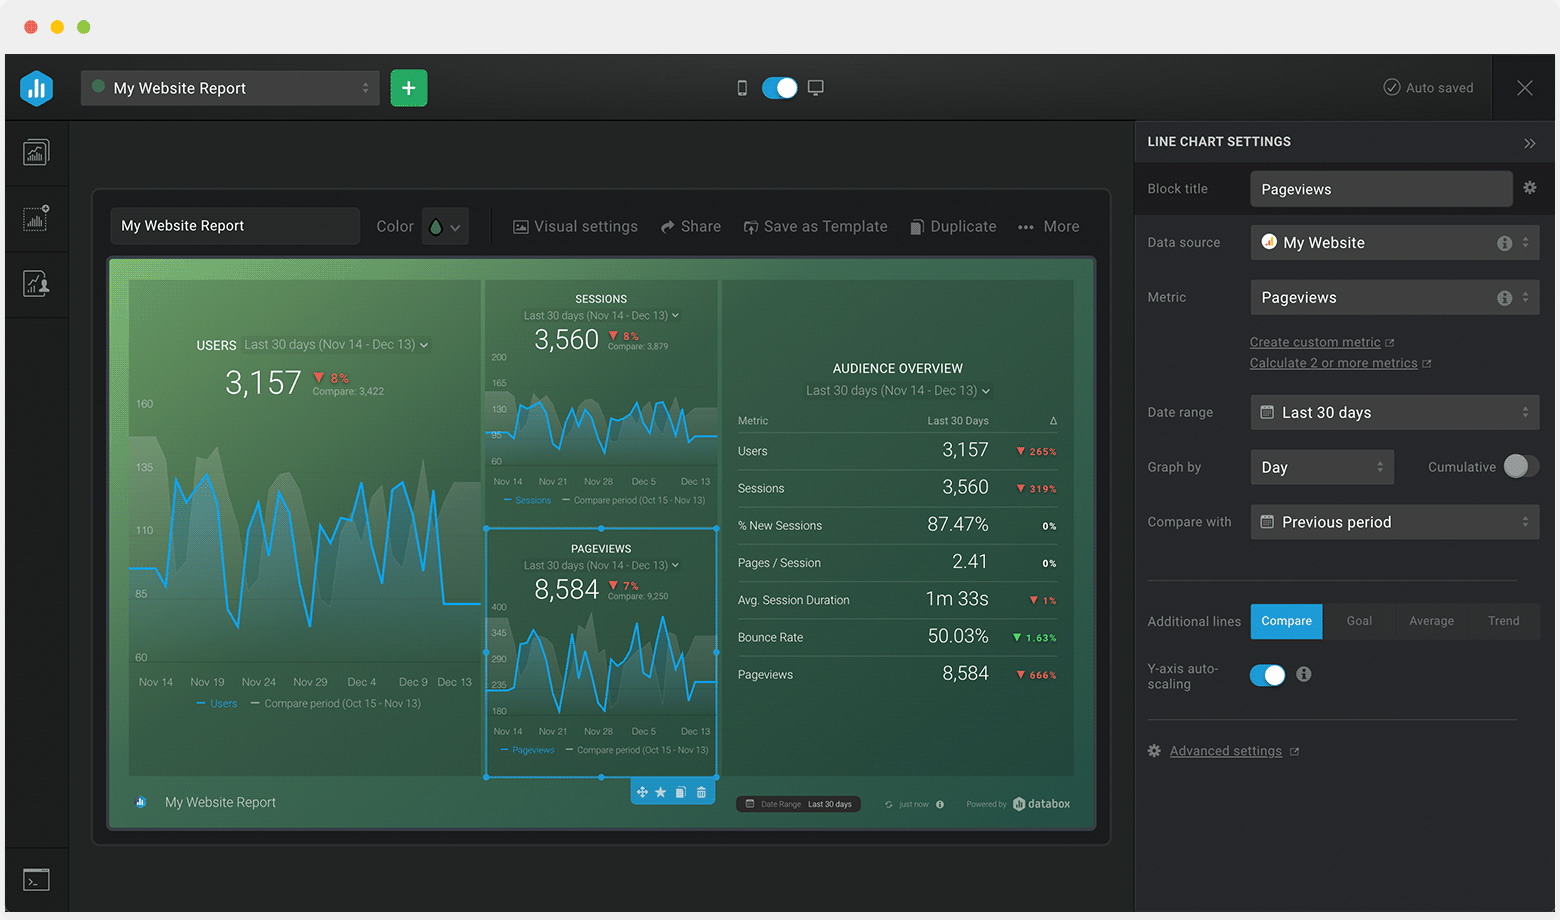
Sometimes, you’ll want to dive deeper into performance. When you need to customize this template (or any other dashboard) to include different metrics, add metrics from different sources, etc., you can do so by using Databox’s Dashboard Designer.
The Designer allows you to easily drag-and-drop metrics and visualizations from any data source right into your dashboard.
Visualizing your eCommerce data in a way that’s easy for everyone to interpret is the first step toward actually improving performance. So, what can you do when any of these metrics is trending down?
We’ve collected a few resources that contain tips from hundreds of other marketing professionals on how to improve your customer lifetime value, conversion rate, organic acquisition traffic, email open rates, and more.
Didn’t find what you’re looking for? Start a conversation with our experts
Creating your account...