


Table of contents
So you’ve been tasked with the delivery of accurate analytics and reporting to your client and manager. One of the most important things you must ensure is that these reports contain the right and accurate data. And another is to make sure the web report is actually understandable to the client.
So, how do you ensure everyone who comes across the report understands it? And more importantly, how do you present data in a way that makes it useful to your client or manager?
In this article, we’ll clear any confusion you might have about web analytics reports by covering the following:
- What is Web Analytics?
- What is a Web Analytics Report?
- What are the Most Commonly Used Web Analytics Metrics?
- How to Create a Web Analytics Report?
- Free Web Analytics Templates

What Is Web Analytics?
Web analytics is the data of your website.
It is a communication map that presents you with pain points that you might not have been aware you had. Web analytics lets you see what’s going well, as well as what’s going poorly, for your business and product. In short, web analytics gives you access to the world around your website.
One thing you should note is that, with web analytics, you can’t just use the numbers presented to try and optimize certain metrics – you have to understand how they work together.
If you are an online marketer or a business owner, you are probably facing a lot of challenges on how to track your web traffic effectively. It’s no secret that Google Analytics is the most popular platform for tracking your website visitors’ actions and behaviors, but there are also other options that you can include in your analytics strategy like data from Mixpanel or Adobe Analytics. Regardless of the tool you choose, you should know that website analytics tools are among the 3 most frequently used for performance monitoring and reporting, as proven by recent research by Databox.
What Is a Web Analytics Report?
A Web Analytics Report is a file containing a snapshot of data from your web domain. This data can be used to make informed decisions for your business. These reports tell you who is coming to your site and why, which in turn helps you better reach out to potential customers or convert existing ones into paying customers.
In other words, a Web Analytics Report is the lifeblood of any website.
These reports are basically documents that contain information about the online presence of a business. They can be broad or specific, but they all have one thing in common: they are extremely helpful sets of information.
However, the interpretation of a web analytics report is not as straightforward as one may assume. This is why many marketers avoid analyzing their website data and instead focus on the more ‘creative’ aspects of marketing such as content marketing or social media.
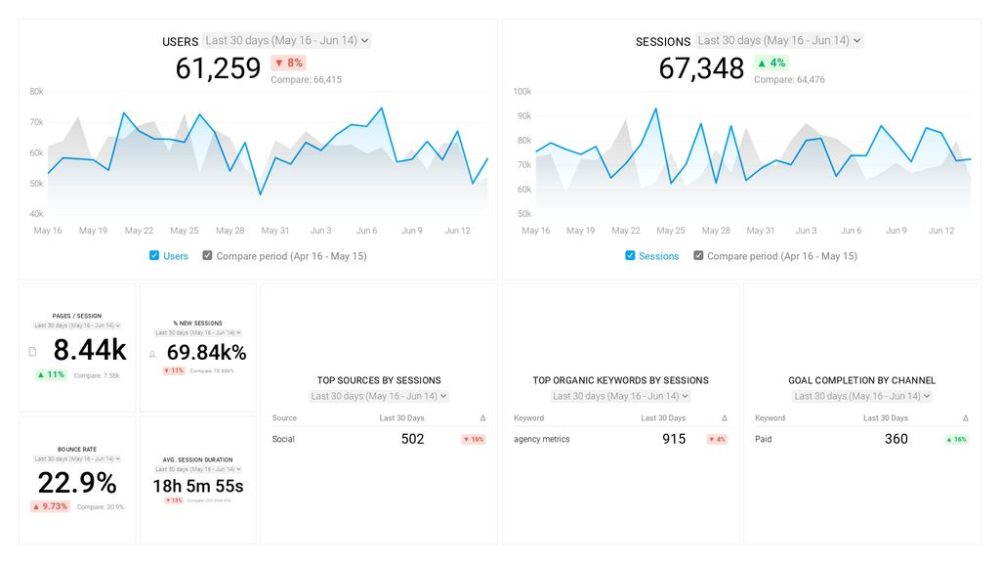
The image below shows one example of a Web Analytics Report from Google Analytics.

What Are the Most Commonly Used Web Analytics Metrics?
With numerous web analytics metrics available to track, it is easy to get lost in endless analysis and consequently spend more time looking at reports than taking an action.
So, what are some of the most important web analytics metrics?
Here are the top metrics marketers often track:
- Website Visitors – The number of visitors you get on your website. You can get visits either from new or returning visitors. New visitors or unique visitors, are the number of people that visited your website within a specific time period. Returning visitors are anyone that have previously been on your website and returned.
- Conversion rate – This is the percentage of people who have fulfilled a specific goal on your website like signing up for your product or newsletter, filling up a form, adding a product to cart etc. The specific action depends on the type of your website and business. Analyzing conversions, for example, along with your traffic, can show you the quality of your leads.
- Exit rate – This is the number of people who viewed multiple pages of your website and then decided to leave, or exited on a certain page. Exit rate can show you what aspects of your website needs optimization. Similar to bounce rate, a high exit rate on certain pages isn’t necessarily bad. Therefore, make sure you analyze this metric along with other relevant data.
- Bounce rate – This is the percentage of people who enter your website and immediately leave without taking any further action. Most marketers try to keep their bounce rates low, howveer, a high bounce rate doesn’t necessarily need to be a bad thing. Since it all depends on the type of the page visited, make sure you analyze this metric along with other metrics.
- Traffic sources – If you want to find out where is your audience specifically coming from, this metric is a must for your Web Analytics Report. There are three different types of traffic to focus on — referral traffic, direct traffic and social traffic.
- Device usage – This measurement reports the percentage of users who access your website through different devices.
- Average Session duration – This measure takes into account events as well as the average time a user spent on your website.
- Pageviews – This metric show how your website visitors view your pages and the number of pages an individual visits on your site before exiting. This metric, like most web analytics metrics, has to be analyzed along with other data ot get a full understanding.
Note: When analyzing your website, it’s quite easy to get caught up in some vanity metrics like bounce rate, time on site, and page views. These metrics can also provide you with a lot of valuable insights, but only when they are paired with other metrics.
PRO TIP: How to track these 10 popular Google Analytics 4 metrics
Sure, there are dozens (and dozens?) more Google Analytics 4 metrics you could track. But, starting with these 10 commonly tracked metrics will give you a pretty high-level view of how your marketing is working…
- Sessions: The number of sessions can tell you how many times people are returning to your website. Obviously, the higher the better.
- Sessions by organic keyword: Which organic keywords bring in the most traffic to your website? This may help you determine whether your SEO investments are paying off.
- Bounce rate: Do visitors leave shortly after landing on your website? Or do they stick around?
- Average session duration: How much time are people spending on your website? Users with a high average session duration are most likely relevant to your company.
- Goal completions: How many users responded to your call to action?
If you want to track these in Google Analytics, you might find the visualizations limiting. It’s also a bit time-consuming to combine all the metrics you need in one view.
To better understand how your website performs in terms of traffic growth and conversions, we’ve made this plug-and-play dashboard that contains all the essential metrics for understanding how successful you are at optimizing different aspects of your website.
You can easily set it up in just a few clicks – no coding required.
To set up the dashboard, follow these 3 simple steps:
Step 1: Get the template
Step 2: Connect your Google Analytics account with Databox.
Step 3: Watch your dashboard populate in seconds.
Now, when we understand the most important metrics we can proceed with creating a Web Analytics Report.
How to Create a Web Analytics Report?
A good report is like a good story. And, a bad report is, well, like a boring story. Of course, not all stories are interesting. But a good report, the same as a good story, does 3 things:
- It sets the reader up to be interested.
- It handles the reader’s questions and doubts.
- It presents information in a way that will interest the reader.
If you want to write a good report, here are some of the things to consider:
- What are the key business concerns? – Determine your objectives.
- Create the report outline. – A good outline is like a road map of your story.
- Define the source of the data. – Adobe Analytics, Google Analytics or something else?
- Present the big picture. – But focus on the details.
- Choose a reliable software support. – Speed up the process of creating your report.
- Connect the data source and software dashboard. – Visualize the data.
- Customize reports with desirable design. – Build the story frame.
- Launch the premiere – Present it to your team or client.
Related: Business Report: What is it & How to Write a Great One? (With Examples)
Free Web Analytics Report Templates
Who doesn’t like free stuff, huh?
We created 100+ Web Analytics Dashboards that track web analytics metrics from some of the most popular analytics tools like Google Analytics, Mixpanel, Adobe Analytics, and more. In case you can’t find your favorite tool among our custom dashboard software lists of integrations, pull any data into Databox via integrations with Zapier, Integromat, Google Sheets, or an SQL database.
With these dashboards, marketing and SEO teams will be able to easily track the performance of their website and make better, data-driven business decisions.
- Google Analytics Website Engagement Dashboard Template
- Google Analytics Landing Page SEO Dashboard Template
- Google Analytics (Ecommerce overview) Dashboard Template
- Google Analytics Traffic Growth Dashboard Template
- Google Ads PPC Performance Dashboard Template
- Google Analytics Social Media Dashboard Template
- Google Analytics Email Marketing Dashboard Template
Google Analytics Website Engagement Dashboard
Here is a simple Google Analytics Website Engagement Dashboard Template that provides you with an overview of the general performance of your website. It’s a good starting point for deeper analysis, and it is based on Google Analytics website traffic and conversion data.

Google Analytics Landing Page SEO Dashboard
Are you worried about your SEO performance? Well, the Google Analytics Landing Page SEO Dashboard Template will alleviate your worries. This template will help you track your organic traffic effectively and spot trends in a timely manner.

Google Analytics Ecommerce Dashboard
If you want to analyze an eCommerce business, a good starting point is to compare the number of transactions made each week or month to the previous time period. That way you can see how sales have been trending. With the Google Analytics (Ecommerce overview) Dashboard Template you have all transactions and revenue information as well as other important eCommerce metrics, at a single display. How cool is that?

Google Analytics Traffic Growth Dashboard
Do you want deeper insights into your website traffic? No problem. We created this Google Analytics Traffic Growth Dashboard that shows your most important traffic sources and metrics like bounce rate and sessions by device category, device branding, social network, geolocation, and more.

Google Ads PPC Performance Dashboard
If you run paid campaigns, you can get a lot of value from tracking performance data. But how do you make sense of it? Everything is easier with this Google Ads PPC Performance Dashboard, which provides a ton of valuable information on your ad groups’ performance and keyword performance.

Google Analytics Social Media Dashboard
This Google Analytics Social Media Dashboard Template will give you a clear picture of your social media performance at a glance. Get real-time data on your traffic by social media channel, goal conversions, bounce rate, and much more.

Google Analytics Email Marketing Dashboard
A short, simple, actionable email report like this Google Analytics Email Marketing Dashboard can help you track your email campaigns in one place. Download this dashboard template to visualize email metrics like signups by campaign type, date, and device.

Present Crucial Web Analytics Data to Your Clients or Key Stakeholders Using Databox Web Analytics Reports
As you saw, web analytics reports aren’t scary. They can actually be pretty easy to set up and when you know what you’re looking for, also incredibly valuable and actionable.
Would you like to take your analytics reports to the next level?
Enters Databox.
Use Databox to monitor all user activity on your website in one place and you reach your business goals faster. Connect your dashboard to visualize data from the most popular website analytics tools such as Google Analytics and Mixpanel, and curate a custom dashboard to share with your marketing team.
Sign up for Databox now and generate your own high-value website analytics reports in just a few clicks.


