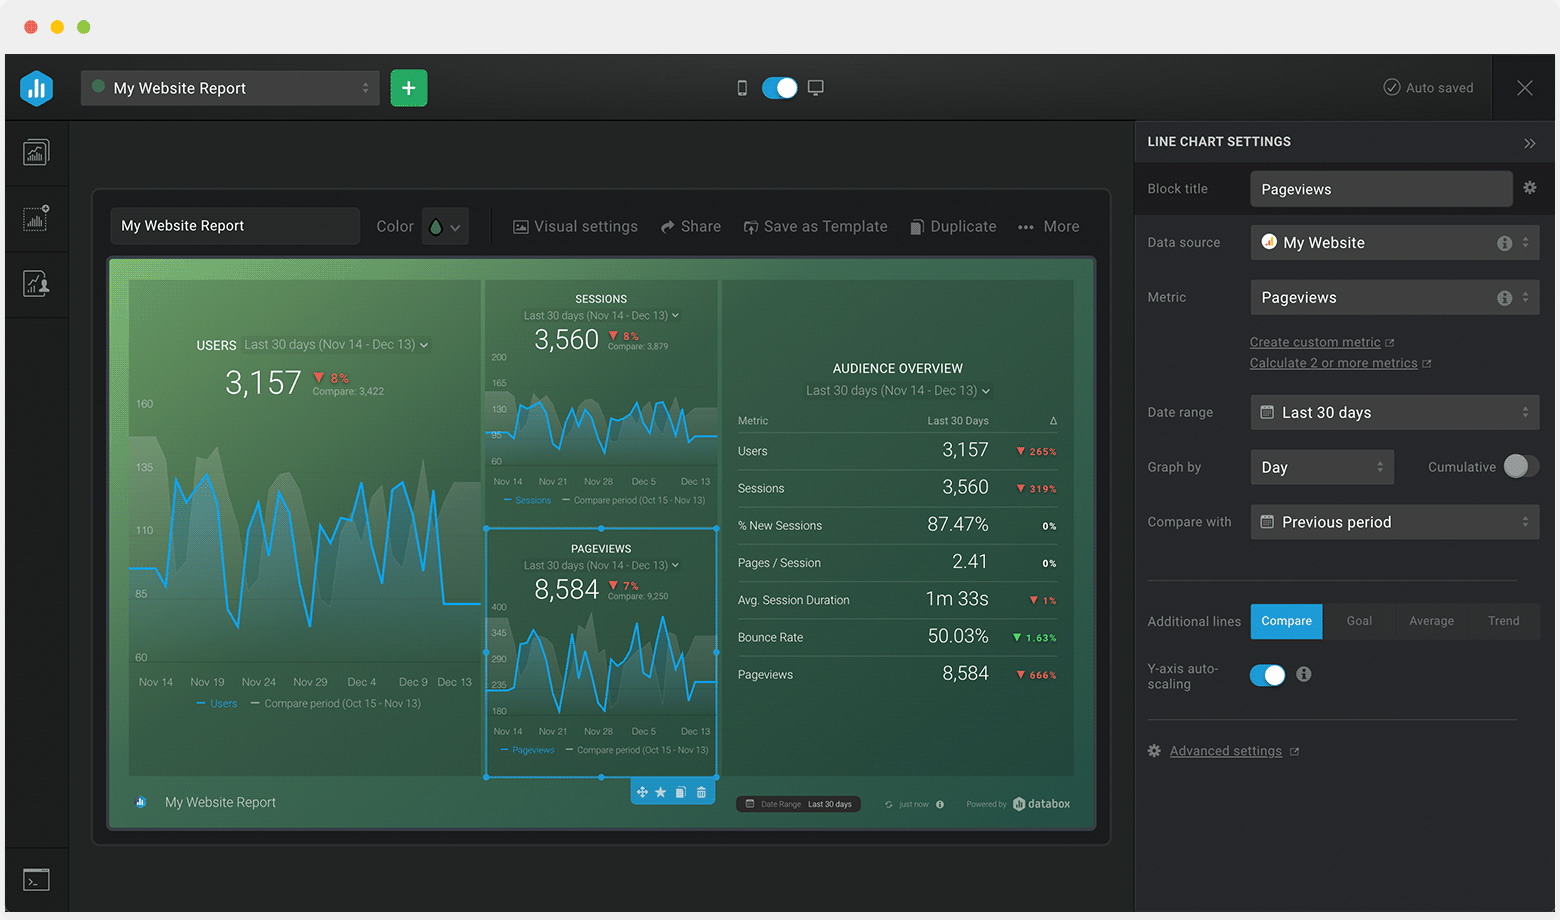
Semrush + Google Analytics Organic Traffic Analysis Dashboard Template

Template created by Databox Databox
Use this free dashboard template to analyze the engagement of your organic traffic. Track keyword rankings, sessions, goal completions, bounce rate, and much more and better connect the dots between your content marketing efforts and search engine performance.

Uses one-click integrations:

  • Google Analytics Google Analytics
  • SEMrush SEMrush

If you don’t use Google Analytics or SEMrush, you can pull data from any of our 70+ one-click, native integrations or from spreadsheets, databases and other APIs.

Get this dashboard for free

What you’ll learn from this Organic Traffic Analysis Dashboard template:

Connect your Google Analytics and Semrush account and learn:

  • Which keywords are we ranking highest for? Quickly track your keyword rankings and see which keywords you’re ranking highest for and which have the highest volume of searches. Use this information to make adjustments to pages that are targeting specific keywords to improve your rankings.
  • What percentage of keywords rank in the top 3? Track your top 3 and top 10 keywords on a weekly and monthly basis. Is your overall percentage of keywords in these top positions increasing over time? Are there spikes or dips in recent performance? Use this information to make necessary adjustments. Better understand the specific search queries that drive people to your website and create more content that supports them.
  • Which pages convert organic visitors best? See which specific pages on your website convert organic traffic at the highest percentage. Track the total number of completions per page as well as the overall conversion rate and identify opportunities for optimization.
  • How much organic traffic does my website generate? Track the amount of traffic from search engines at any given time. Track performance on a daily basis to spot any spikes or dips and attribute this performance to your marketing efforts.
  • Is our organic traffic high quality? Track the overall engagement of your organic visitors. Measure things like average sessions duration and bounce rate specifically from organic traffic and determine whether or not your marketing efforts are driving highly qualified, highly engaged visitors back to your website.

Pull additional data using our deep integration with Google Analytics

What other campaign metrics can you track and visualize with Google Analytics?

  • Website traffic and conversions
  • Traffic and lead demographics
  • SEO results
  • Social media engagement
  • Paid advertising
  • Landing page performance
  • Campaign performance using custom events

There are many, many different metrics and metric combinations you can track using Google Analytics. And in Databox, you can quickly visualize 100s of Google Analytics metrics in a variety of different ways.

Read more about Databox’s Google Analytics integration.


Pull additional data using our Semrush integration

What other campaign metrics can you track and visualize with Semrush?

  • Visibility trend
  • Keyword rankings
  • Estimated traffic
  • Rankings distribution
  • Site errors and warnings
  • Incoming internal links
  • Competitor intelligence, and more

There are many different metrics and metric combinations you can track using these integrations. And in Databox, you can quickly visualize dozens of Semrush metrics in a variety of different ways.

Read more about Databox’s Semrush integration.

Google Analytics Google Analytics metrics included in this template
  • Goal Completions, Organic

  • Goal Completion Rate, Organic

  • Goal Value

    Value produced by Goal Conversions on your Site during specified Date Range. This value is calculated by multiplying the number of Goal Conversionsby the value that you assigned to each Goal.

  • % New Sessions, Organic

  • Organic Bounce Rate

  • Avg Session Duration, Organic

SEMrush SEMrush metrics included in this template
  • Top Keywords by Volume

    Top Keywords split up by Volume. The metric can be found in the Position Tracking.

Customize dashboard
Explore all of Databox’s functionalities:

Customize this dashboard with Databox

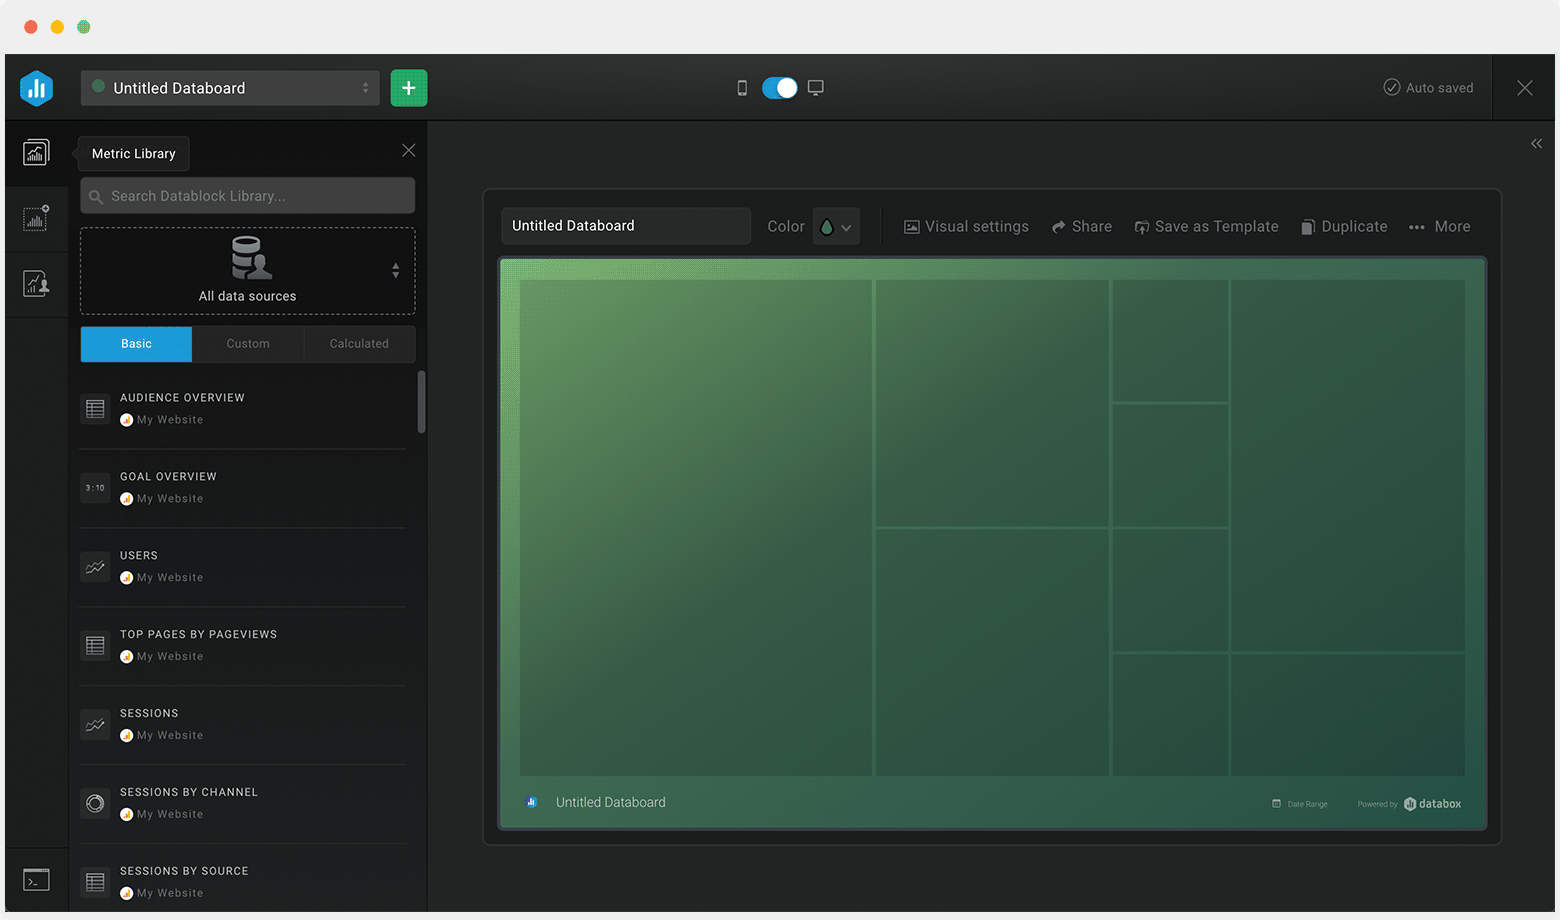
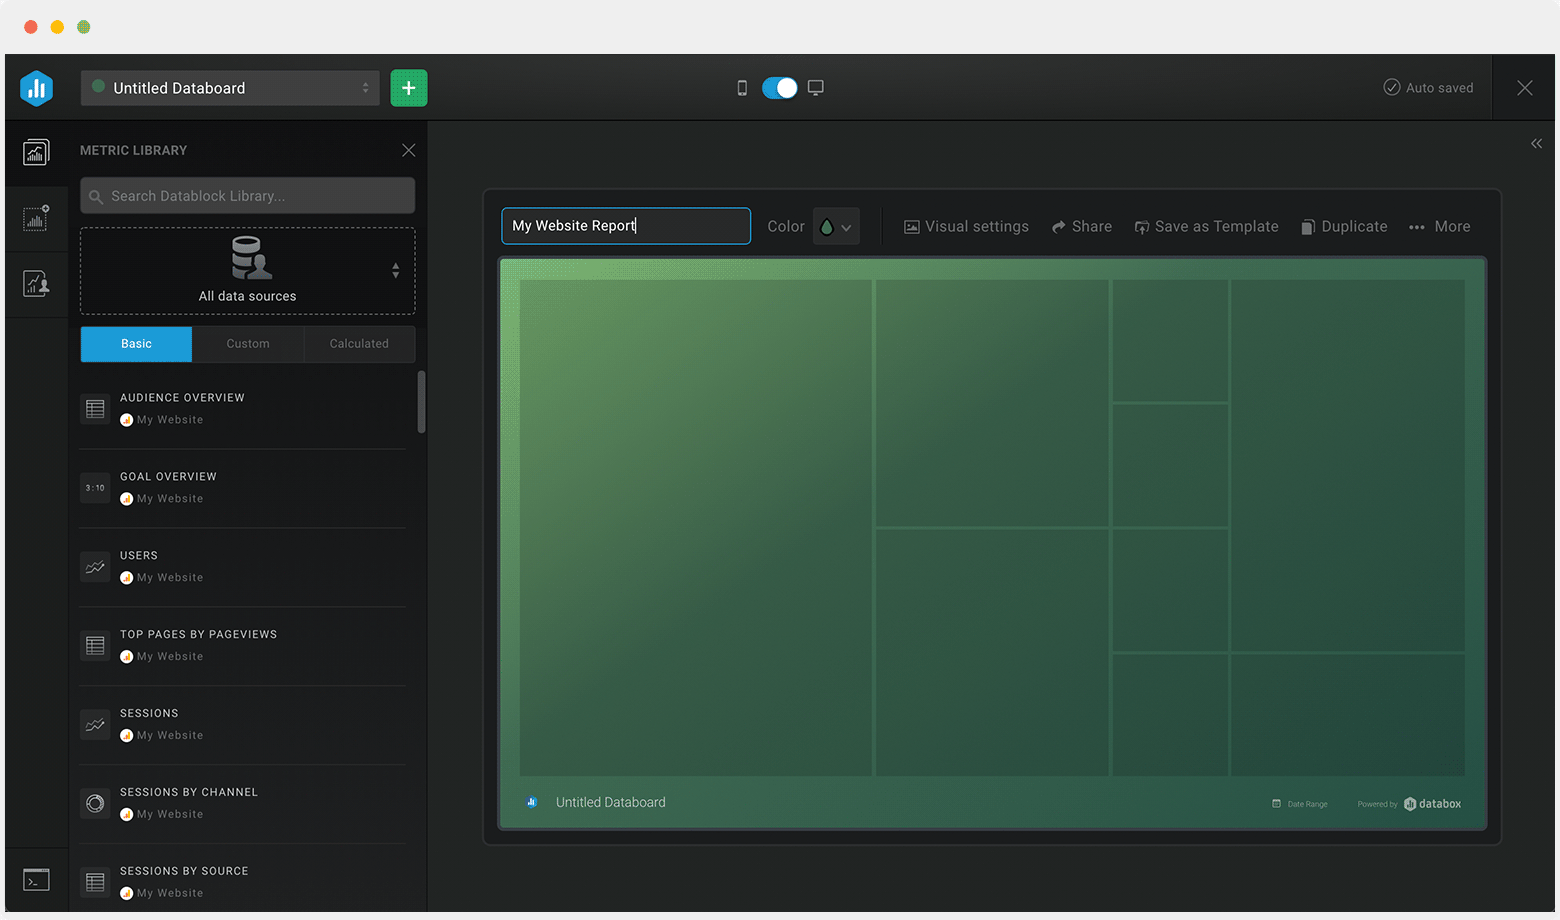
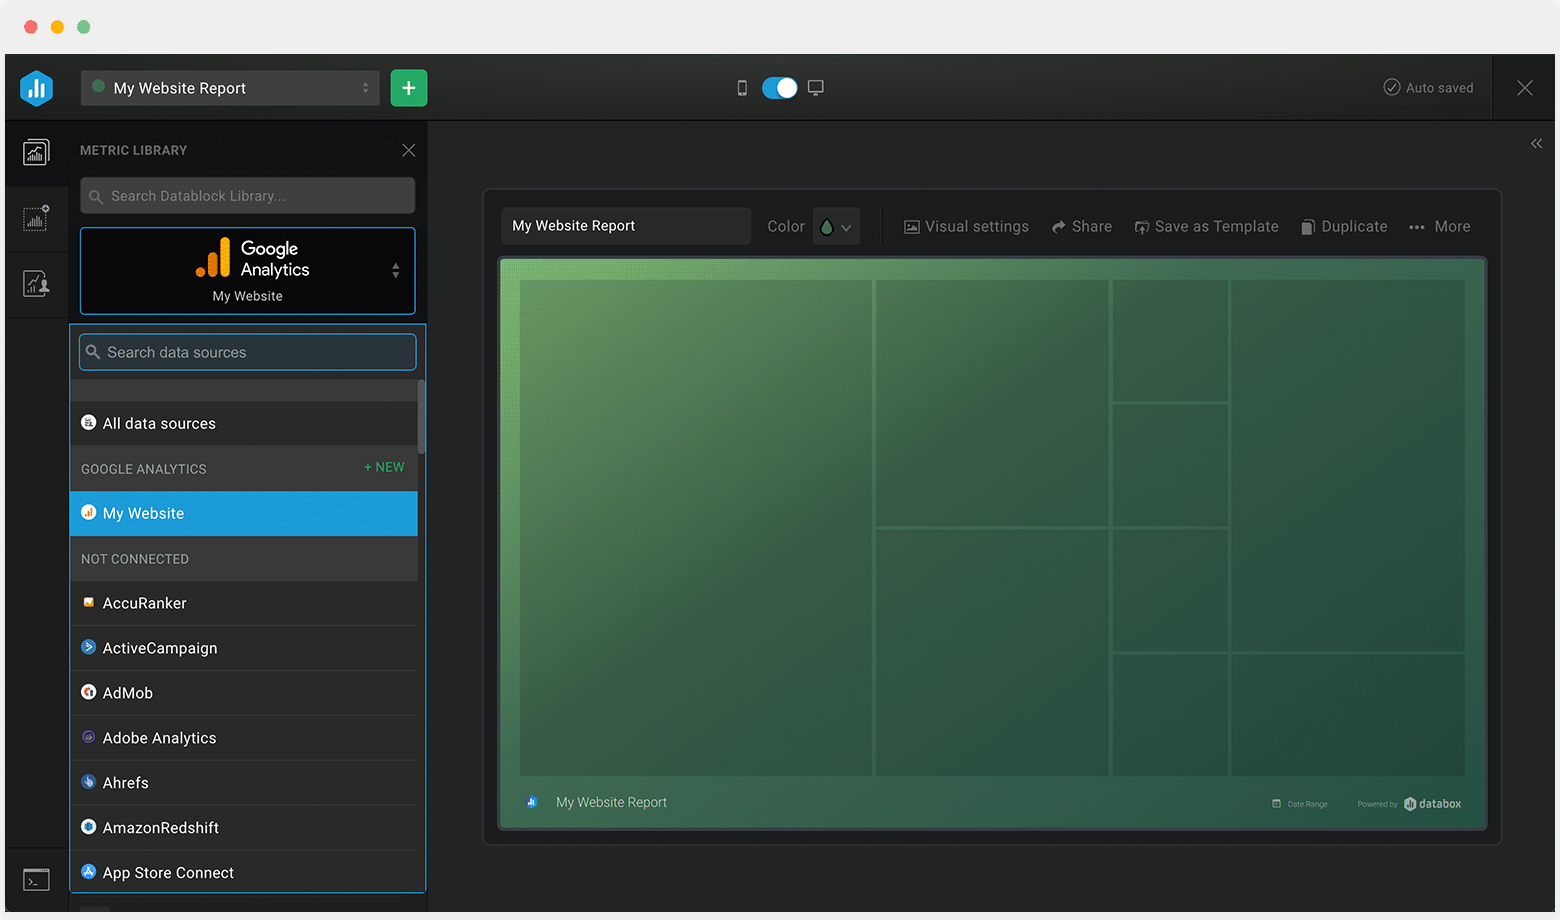
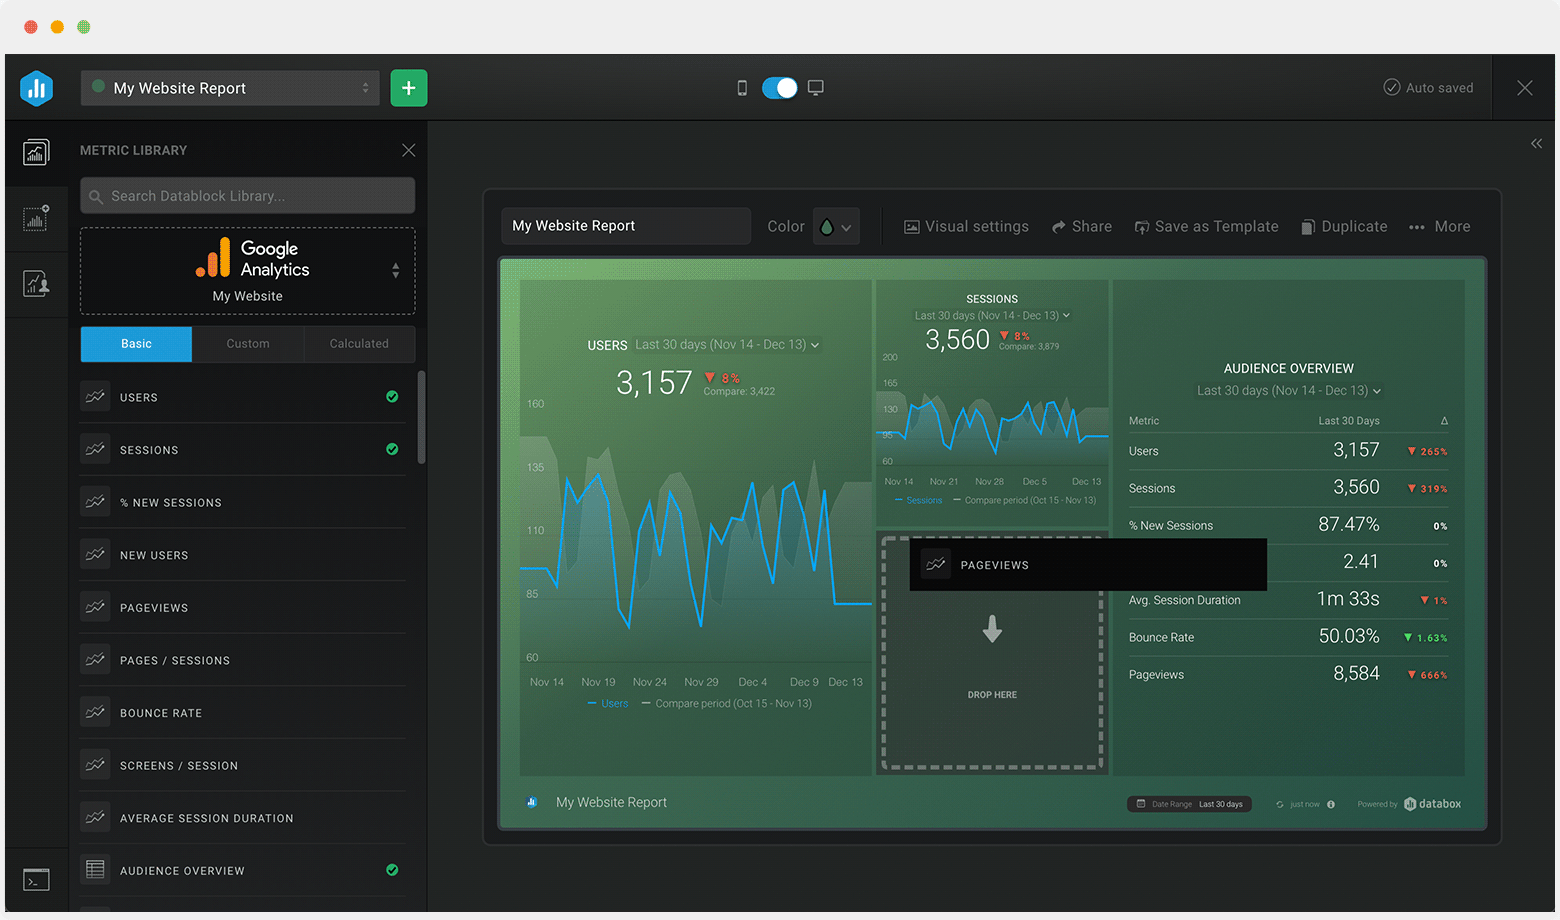
Sometimes, you’ll want to dive deeper into performance. When you need to customize this template (or any other dashboard) to include different metrics, add metrics from different sources, etc., you can do so by using Databox’s Dashboard Designer.

The Designer allows you to easily drag-and-drop metrics and visualizations from any data source right into your dashboard.

Get Started