Table of contents
As marketers, finding ways to save time and streamline workflow is always top of mind. But what if you could tap into the power of Google Analytics automated reports to unlock valuable insights without the manual hassle? Imagine having key data delivered right to your inbox, ready for analysis and decision-making, while you focus on strategy rather than data extraction.
Curious about how it works and how to set it up? Dive into the benefits and practical steps for leveraging Google Analytics automated reports to transform how you track and act on your data.
- What are Google Analytics automated reports?
- How do I get Google Analytics reports?
- Benefits of Using Google Analytics Automated Reports
- How do I set up automated reporting in Google Analytics?
- What are the standard reports in Google Analytics?
- Google Analytics Automated Report Types and Examples

What are Google Analytics Automated Reports?
Automated Google Analytics reports provide a summary of your Google Analytics data, organized by different metrics. Using automated reports allows marketers a quick and easy way to stay in touch with their Google Analytics account through daily email summaries!
Google Analytics Automated Reports can save you time by providing an automatic the process of generating and sharing reports, eliminating the need for manual data extraction and report creation.
In addition to saving valuable time, automated reports allow us to be more strategic when it comes to troubleshooting issues in our accounts because we have all of the important information gathered in one place. Plus, there’s no need for an extra login or extensive digging – just open up your email inbox!
Google Analytics automated reports are available in Google Analytics premium. If you’re already a Google Analytics premier partner, this is something that your clients can take advantage of. The free version of Google Analytics does not have the capabilities to automate reporting however there are many templates and resources available for marketers looking to create their own reports.
How Automated Reports Work in Google Analytics
The Mechanism Behind Automated Reporting
Automated reports in Google Analytics use machine learning algorithms to analyze data and identify patterns, trends, and anomalies, providing relevant insights to your business. These reports automatically collect and process data from your website or app, organizing it into pre-defined or custom templates based on your specified metrics and dimensions.
Differences Between GA4 and Universal Analytics Automated Reports
While Universal Analytics allowed setting up recurring email reports, Google Analytics 4 (GA4) has a different approach. In GA4, you can export and share reports, and set up email alerts for significant changes, but the traditional automated email reports are not available. This shift reflects GA4’s focus on real-time data analysis and more flexible reporting options.
How Do I Get Google Analytics Reports?
As mentioned before, Google Analytics provides automated reports to Google Analytics premium users. There are a number of templates available depending on what you’re looking to review in your account, including
- Audience Overview Summary
- Goal Details Report
- Traffic Sources Overview Report
- Ecommerce Transactions Report
If you don’t have access to Google Analytics premium account or want more control over the data that’s included in your report, there are also many third-party solutions such as Databox or Google Analytics studio that you can find helpful. These tools allow marketers to create custom reports based on their Google Analytics data quickly and easily! Plus it can save time if you find yourself building similar ones repeatedly. You can simply reuse them rather than starting from scratch every single time.
Want even more automation? There are Google Analytics automated reports available for teams. Google Analytics manager accounts allow you to add access and permissions for multiple users on your team, meaning that more than one person can be responsible for checking up on their Google Analytics data.
Related: How to Set Up & Use Google Analytics Across Multiple Websites
Best Practices for Automated & Scheduled Reporting
Choosing the Right Metrics for Your Reports
When creating automated reports, it’s crucial to focus on the metrics that are most relevant to your marketing strategies. This might include key performance indicators (KPIs) such as goal completions, landing page performance, pageviews, conversion rate, and bounce rate. By carefully selecting these metrics, you ensure that your reports provide actionable insights rather than overwhelming data.
Optimizing Report Frequency and Timing
The frequency of your automated reports should align with your business needs and decision-making cycles. While daily reports might be necessary for some metrics, others may be more suitable for weekly or monthly reporting, depending on your scheduling options. Consider the volatility of the data and explore scheduling options that align with your decisions when setting up your report schedule. Expert advice from our SEO team: We suggest scheduling monthly reports to be sent two days after the month ends to ensure that all data for the entire month is fully gathered. This ensures your team receives relevant insights at the right time for maximum impact.
Benefits of Using Google Analytics Automated Reports
Google Analytics automated reports offer many benefits including saving time, staying organized, having a better understanding of the data in your account, being able to troubleshoot potential issues with ease, and much more.
What’s most important to marketers though is that they give insight into what’s happening across all areas of the website which allows them to develop efficient marketing strategies quickly.
Let’s take a look at these benefits in detail.
- Tracking Online Traffic
- Customizing Data Reports
- Improving Online Advertising
- Identifying Your Target Audience
- Understanding User Behavior
Tracking Online Traffic
Google analytics automated reports are great for tracking online traffic. Google Analytics Automated Reports collect data about Traffic Sources, visitors Age and Gender from third-party Cookies, Android Advertising ID, and more — all information that is helpful for identifying and better understanding visitors’ interests, and ultimately creating more targeted marketing campaigns.
These reports help in tracking online traffic, understanding visitor demographics, and identifying trends in user behavior, which is crucial for developing targeted marketing campaigns.
Customizing Data Reports
Google Analytics automated reports have an extensive library of pre-built reports to help you get started, such as Real-Time Changes, Conversion, Audience, Behavior, and Acquisition reports. Using Google Analytics automated reports allows you to customize the data so that it best meets your needs. This means no more wasting time looking for specific metrics or digging around in data when all of this information is readily available.
Automated reports or so called scheduled reports are the first step towards analytics automation. They can be customised to include specific metrics and dimensions, allowing you to focus on the data that is most relevant to your marketing strategies.
Improving Online Advertising
Google Analytics automated reports help you to understand your website data and google analytics metrics better which means that you can increase the effectiveness of online advertising. Whether it’s making changes to an existing campaign or creating new ones, by having a clear picture of how people are interacting with your ads, marketing teams will be able to make more informed decisions about their strategy moving forward!
Identifying Your Target Audience
Using Google Analytics automated reports, marketers can easily identify their target audience and generate ideas for improving user engagement. An accurate target audience can help you adjust your reports to better communicate with the people you want to reach. Here is a set of 9 expert best practices on how to identify your target audience.
Understanding User Behavior
Marketers can use Google Analytics automated reports to find out how people are interacting with their website and where they’re dropping off. By pinpointing the issue, you’ll be able to make changes that will improve user experience which should lead to an increase in conversions.
Related: Get the Most Out of Google Analytics’ Behavior Flow Report with These 6 Tips
6 Simple steps on how to automate google analytics reports?
When setting up Google Analytics automated reports, you can select the data that you want to include in your report. You also have the option of using Google’s pre-made reporting templates or building a custom report based on specific metrics and dimensions.
To set up Google Analytics automated reports, you need to do the following:
- Log into Google Analytics: Access your GA4 property.
- Navigate to the Reports Section: On the left-hand menu, click on “Reports.”
- Select the Desired Report: Choose the report you want to automate.
- Share the Report: In the top-right corner, click on the “Share this report” icon.
- Schedule Email: From the dropdown, select ‘Schedule Email’ to set up an email notification for report delivery.
- Configure Email Settings: By entering a unique report name, adding up to 50 report recipients, setting the start date for the schedule, choosing the frequency (daily, weekly, monthly, or quarterly), defining the duration for which the report will remain active (1 to 12 months), selecting the report format (PDF or CSV), and specifying the language for the report. You can further customize your automated reports by adjusting the report parameters to include the specific data metrics and dimensions (date range, metrics, dimensions, segments, filters) that align with your goals.
- Save the Schedule: Click “Save” to finalize the scheduling.
For more detailed information, refer to Google’s official guide on scheduling reports in GA4. (Google Support)
You’re all done! Now that automating Google Analytics reports is set up, marketers can check out their data from anywhere with an internet connection without having to navigate the interface – saving them time and energy for other important tasks!
PRO TIP: Save Time Creating Your Google Analytics 4 Traffic Dashboard
Yes, you can DIY in Google Analytics 4, but what if you would prefer a simpler, easier route? After all, once you learn how it’s done, you still have to choose the right metrics and design your custom dashboard to answer the important questions your stakeholders have, for example:
- How many people are visiting my website?
- Which channels bring in the most users?
- How engaged are my users?
- How well is my website keyword optimization performing?
and more…
Now you can benefit from the experience of Google Analytics experts, who have put together a great Databox template showing all the most important website traffic KPIs. This template allows for easy integration with scheduled report delivery. It’s simple to implement and start using as a standalone dashboard or in marketing reports!
You can easily set it up in just a few clicks – no coding required.
To set up the dashboard, follow these 3 simple steps:
Step 1: Get the template
Step 2: Connect your Google Analytics 4 account with Databox.
Step 3: Watch your dashboard populate in seconds.
What are the Standard Reports in Google Analytics?
Here are the 5 most important standard reports in Google Analytics:
Real-Time Reports
Real-time reports allow you to see what’s happening on your website right now, which can be useful for identifying any sudden changes or issues that might need attention quickly.
Audience Reports
Audience reports cover data on who’s visiting your website and what they’re interested in. You can track data such as:
- Demographics (age, gender & language)
- Location
- Mobile devices used to access the website
- The technology used to browse the site (browser type and system attributes)
This information allows you to gain a better understanding of your target audience so that you can create more relevant content or ad campaigns.
Traffic Sources Reports
Traffic sources reports show you where your traffic is coming from. Also, this is the largest category of reports – with 25 different reports available. All these reports help you to understand how your traffic is generated, from tracking the keywords that people use to find your website, to how long they stayed on a certain etc. You can also see which search engines or social networks are most effective at generating visitors.
Note: Some of these reports require you to connect your Google Analytics account to your Webmasters Tools account.
Content Reports
If you wondered what’s popular on your site, where people spend most of their time, and what they click on, then you should take a closer look at your content report. You can also use content reports to find out how well your calls-to-action perform, which pages convert the best or bring in the most visitors, where people exit on average (so you know what content is less engaging), and much more.
All in all, these reports will help you to understand what content your audience is interested in and how they interact with it.
Conversion Reports
Conversions are maybe the most important metric you need to track. If you’re looking to see how many people complete your desired actions (e.g. purchase, subscribe, etc.) on the website; these reports will give you all the answers! You can also take advantage of these reports to track trends and build conversion funnels which allow you to test different paths that visitors take through the site, ultimately helping you improve your conversion rate optimization strategy.
Troubleshooting Common Issues with Automated Reports
Dealing with Data Discrepancies
Data discrepancies can occur due to various reasons such as sampling, time zone differences, or filtering issues. To address this, regularly cross-check your automated reports with raw data, ensure consistent time zone settings across your analytics tools, and be aware of any filters or segments applied to your reports.
Resolving Email Delivery Problems
If you’re experiencing issues with email delivery of your automated reports, check your email spam filters, verify the email addresses of recipients, and ensure that your Google Analytics account has the necessary permissions to send emails. Additionally, consider using alternative delivery methods such as shared links or integrations with other reporting tools.
Google Analytics Automated Report Types and Examples
With so many metrics and KPIs available, Google Analytics can be quite a complicated tool to navigate and even more complex for creating easy-to-understand reports. There is a better way to showcase your Google Analytics data other than using PowerPoint presentations, Google Sheets, or Excel. And that’s with Google Analytics automated reporting software like Databox.
Here’s how your GA reports could look like:
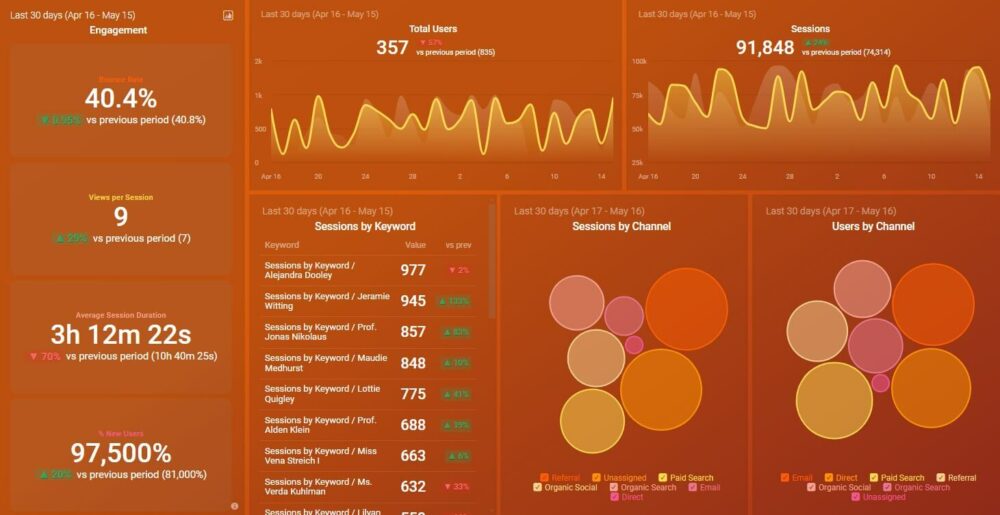
Google Analytics Report Template
Marketers use this Google Analytics report template to track their most important website engagement metrics, such as:
- Bounce Rate
- Conversions
- Unique Visitors
- Total Traffics
- Geo metrics (country, city, area)
- Long vs Short Sessions (how long people stay on the website)
- % New Visits (the percentage of visitors that are new to your site)

Use this report if you want to have a general overview of how your website is performing and converting at-a-glance at any moment.
SEO Report Template
“Organic juices” are as much important as all other metrics, and google analytics automated reports for SEO will give you an overview of how well your website is performing in organic search results. Learn more about your on-page SEO by analyzing this SEO report continuously.

This Google analytics automated report is great for obtaining data on how well your content ranks in the search engines. You can track:
- Organic Sessions
- Top Organic Landing Pages
- Organic Conversion Rate
- Sessions vs. Bounce Rate
- Top Organic Keywords
- Average Session Duration
This report will give you insight into what’s working best when it comes to SEO (organic results), whether it be certain keywords or specific pages of content.
Web Analytics Report Template
In case you are running campaigns on social media and Google AdWords, this is one of the best automated report templates for GA. It covers all of the key metrics you’ll need to track the progress of your campaign. Such as:
- Organic Sessions vs Paid Traffic
- Landing pages
- Overall goals
- Conversions
- Campaign performance
- Social media performance
- AdWords performance

You can use this Google Analytics automated report to compare the success of your social media and ad campaigns. You will be able to see which campaign performs better, what pages they are going through, how many goals they complete etc.
This will allow you to determine what works well with regard to paid advertising and which type of audiences engage with your website more frequently – via organic or social referrals.
Advanced Features of Google Analytics Automated Reports
Using Segments in Automated Reports
Segments allow you to analyze subsets of your data, providing more targeted insights. By incorporating segments into your automated reports, you can compare different user groups, traffic sources, or behaviors, leading to more nuanced and actionable insights.
Integrating Goals and Conversions into Reports
Incorporating goals and conversion data into your automated reports helps you track the effectiveness of your marketing efforts.This integration allows you to see how different segments or channels contribute to your overall business objectives through saved reports, enabling more informed decision-making.
Comparing Google Analytics Automated Reports with Other Analytics Tools
Pros and Cons of Google Analytics Reporting
Google Analytics offers comprehensive data collection and analysis capabilities, integration with other Google products, and is free for most users. However, it can be complex for beginners and has limitations on data retention and customization in its free version.
Alternative Tools for Automated Web Analytics Reporting
While Google Analytics is widely used, other tools like our Databox or Adobe Analytics, Mixpanel, or Matomo offer different features and may be more suitable for specific business needs. These alternatives often provide more customization options, longer data retention periods, or specialized analytics for specific industries.
Automate Google Analytics Reporting with Databox
Are stakeholders requiring data reporting and analytics? Now that you know how useful Google Analytics automated reports are, wouldn’t it be great if there was an easy way to generate all of these on a daily, weekly, or monthly basis?
With Databox dashboards, you can track data from all the different tools you’re using in one place, pull in your most important website analytics metrics from anywhere, visualize any metric with one click, track current and historical performance, access your dashboards everywhere, and finally, make changes to your reports in minutes, not hours.
Automated reports facilitate data visualization through visually appealing charts, graphs, and widgets, making it easier to interpret and act on the data. These reports can be shared easily with team members, stakeholders, and clients, ensuring everyone has the necessary insights to make informed decisions.
Sounds too good to be true? Then sign up for a free trial now and see for yourself why we are one of the leading reporting tools on the market.