


Table of contents
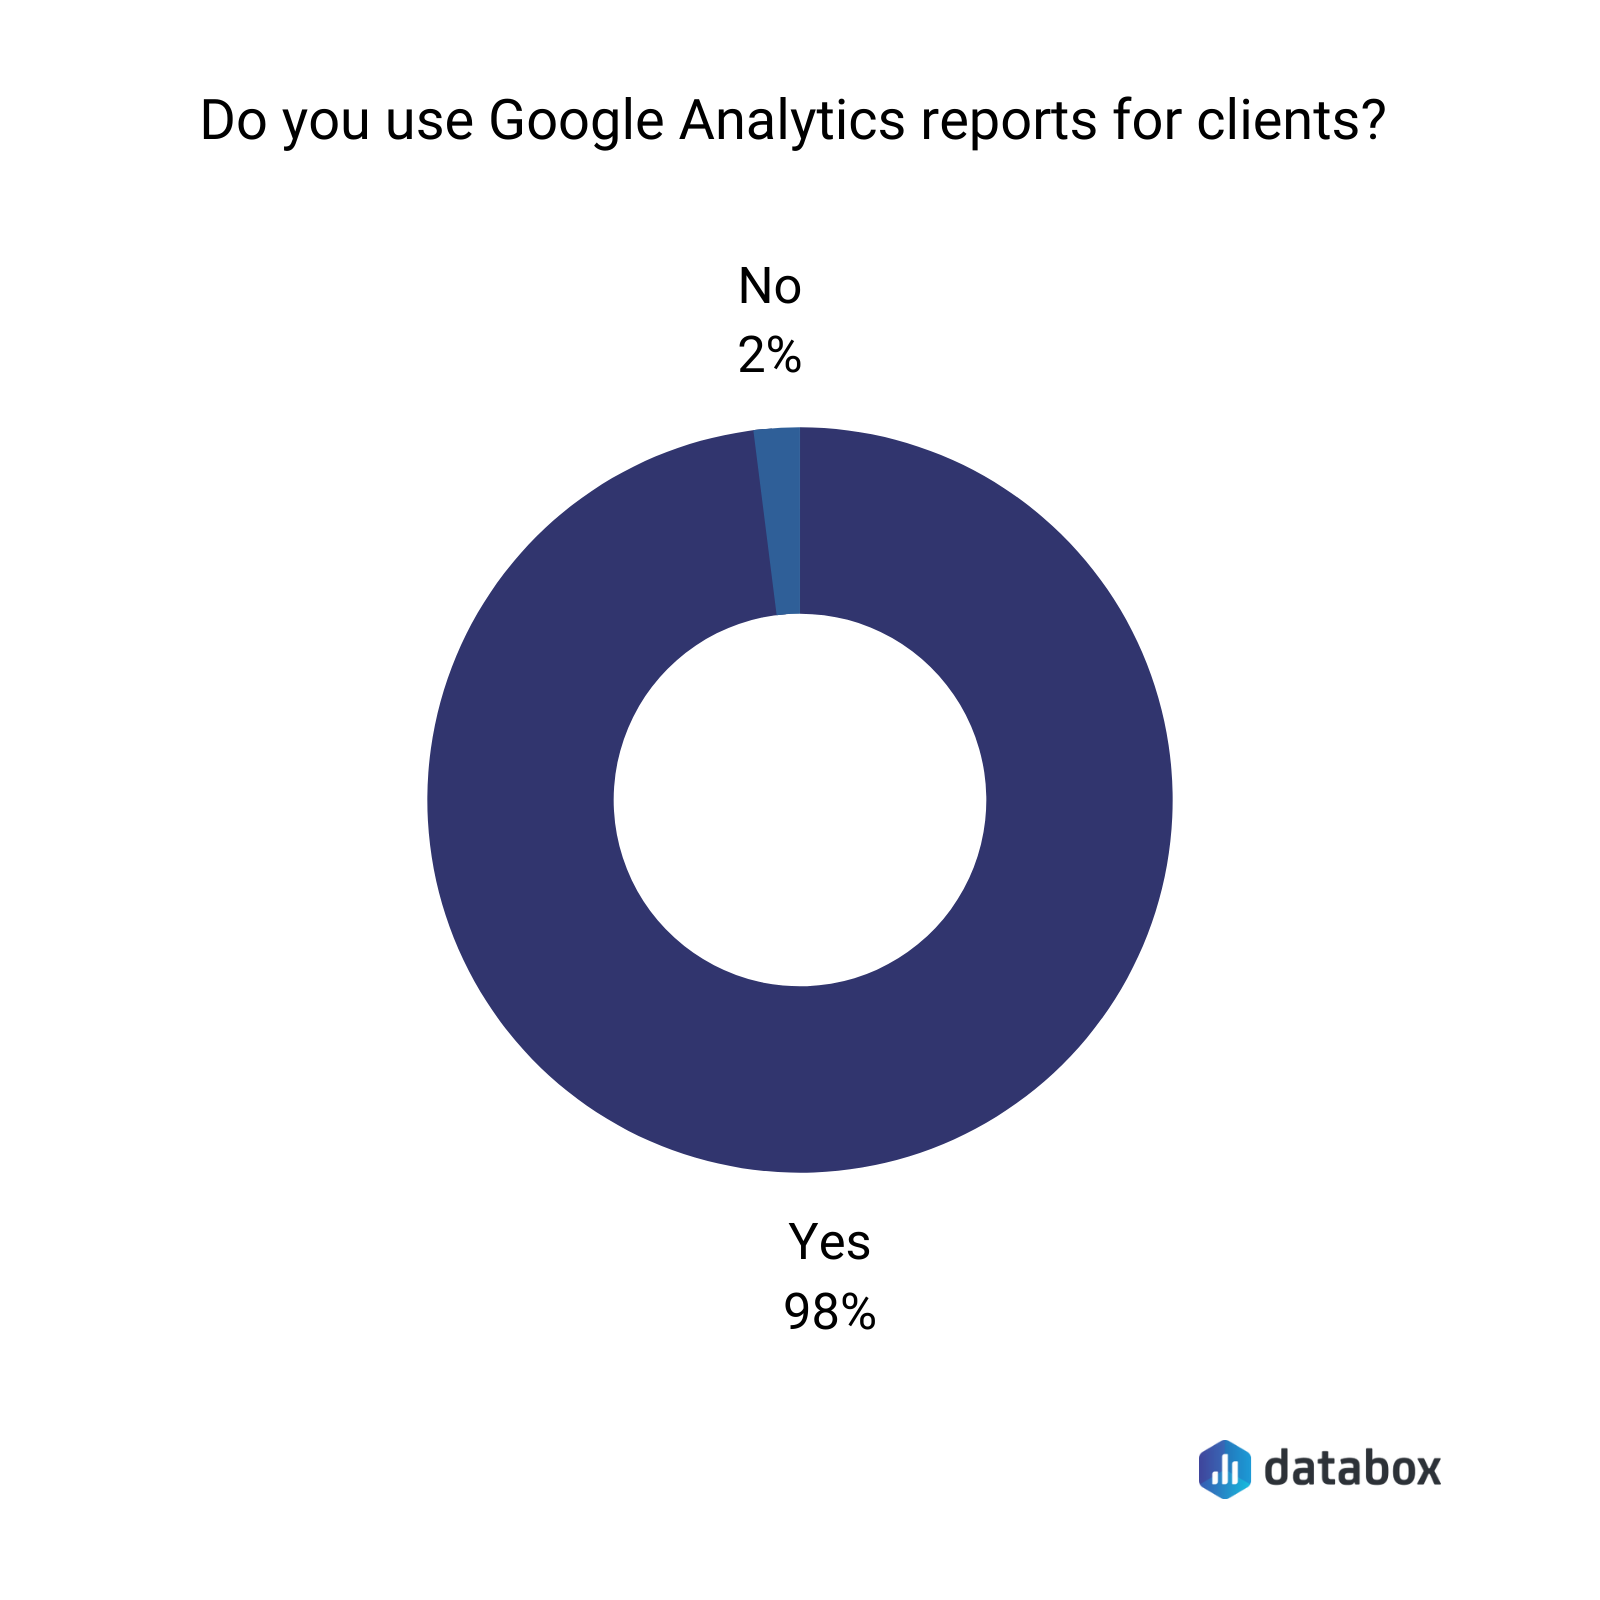
When it comes to client marketing reports, you’d be hard-pressed to find a better, free tool than Google Analytics. And, a whopping 98% of the marketers we surveyed agree.
However, if you are not a tech-savvy marketer, Google Analytics can be extremely overwhelming. It is easy to get lost in all of the data.
This leads your clients to either get stuck in analysis paralysis or abandon their Google Analytics account altogether. Neither are ideal outcomes.
The way to avoid these two unfortunate outcomes is to set up client reports and dashboard templates.
In this post, we’re sharing the top Google Analytics client reports, including:
- Acquisitions overview report
- Goal completions report
- Conversion report
- Mobile overview report
- Efficiency analysis report
- Browser report
- Referring pages report
- Keyword analysis report
- Retention report
- Customer acquisition report
- Location report
- Channels report
- Source medium report
- Site speed overview report
- Google Ads report
- Average time on page report
- Path length report
Acquisitions Overview Report
Marketing 101 is knowing how your ideal customers are finding you. The Acquisitions Overview Report can give you some answers to this.
“One Google Analytics report I will use is an Acquisitions Overview Report,” says Cary Haun of Twelve Three Media. “Since much of the Audience and Behaviors reports, arguably, have a lot of overlap in terms of demographics, locations, personas, search patterns, technology, and so on – I find it helpful to closely track and observe *how* a user’s attention was caught, and what specifically was it that was enticing enough for them to click. Since all of SEO is, at its base, a sales pitch, it is interesting to try and spot exactly when and where desire takes over.”
Barbara Sawala of Uploadcare says, “As an SEO entrepreneur I surely use Google Analytics for my client reports. I usually send them Acquisition > All Traffic Channels screen/report to show them how their various channels convert, # of users from each channel, and what is the bounce rate and avg. session duration. This is especially useful for ecommerce and websites with various social media profiles – people are able to see the financial performance of their campaigns and decide whether it is worth investing in paid campaigns or not.”
Cristian Ungureanu of QuickMail adds, “It’s my favorite because it gives a quick yet comprehensive peek at the state and progress of all our acquisition channels. I can see how our efforts are paying off (or failing to bring results) across the board, and find new opportunities for growth (for example, if a certain acquisition channel is bringing in less traffic than it should). All in all, it’s a great report that I was able to set it up in literally 1 minute.”
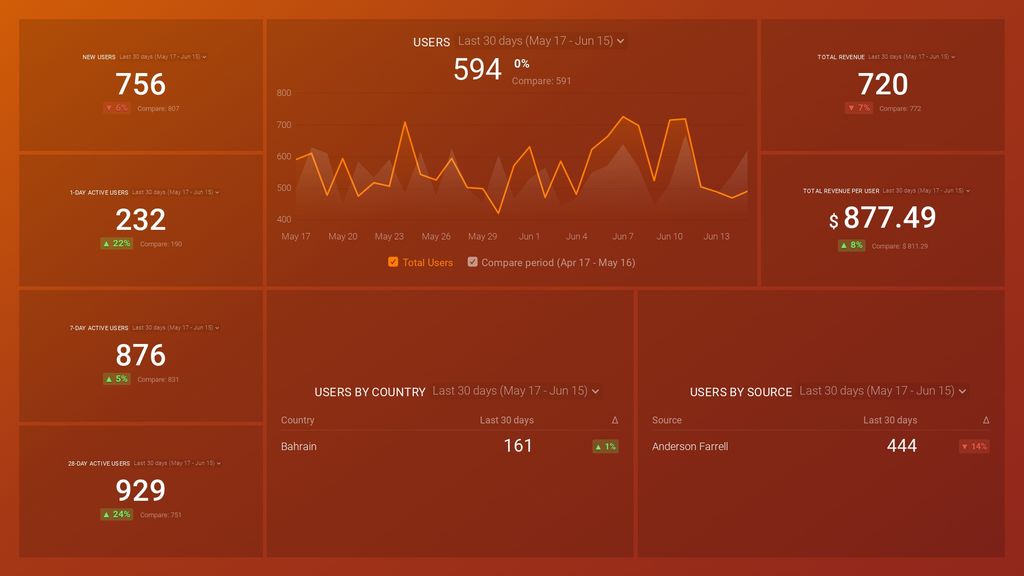
Here is an example of a Google Analytics Acquisitions Overview Report from Databox. Marketers rely on this Google Analytics Acquisition Snapshot Dashboard to analyze their top-performing traffic sources.

Goal Completions Report
Setting up custom goals, like new leads, sales, etc., in Google Analytics and then reporting on them via the Goal Completions Report is a great way to demonstrate ROI to your clients.
“A lot of people don’t know that you can set goals in Google Analytics,” says Jon Torres. “A goal represents any completed action by your visitor, such as a purchase, email sign up, getting to a certain page of your funnel, or submitting a contact form, etc. Goals help me understand how people are interacting with my website, how long it took them to complete the goal, and how they arrived at the final action. Without goals, it would be difficult for me to collect data on my visitors in order to improve the UX of my site.”
Sai Kalki of DigiGrow adds, “The most important report I use for clients is the Goal Completions Report because it gives my clients an idea of how many leads I generated for them. This report has a direct correlation with the Return on Investment I delivered for my clients.
And how do you set up this report? “Once you log into Google Analytics, follow this path: Admin > View > Goals Next click on New Goal. You can then proceed to set your goal as per your client requirements.”
And how do you track this report? Wait for at least a month before you check the report. This gives the tool enough time to collate the necessary metrics and provide you a complete picture. Then head over to the Conversions tab on Google Analytics, click on Goals and then click on Overview. This image gives a better idea.”
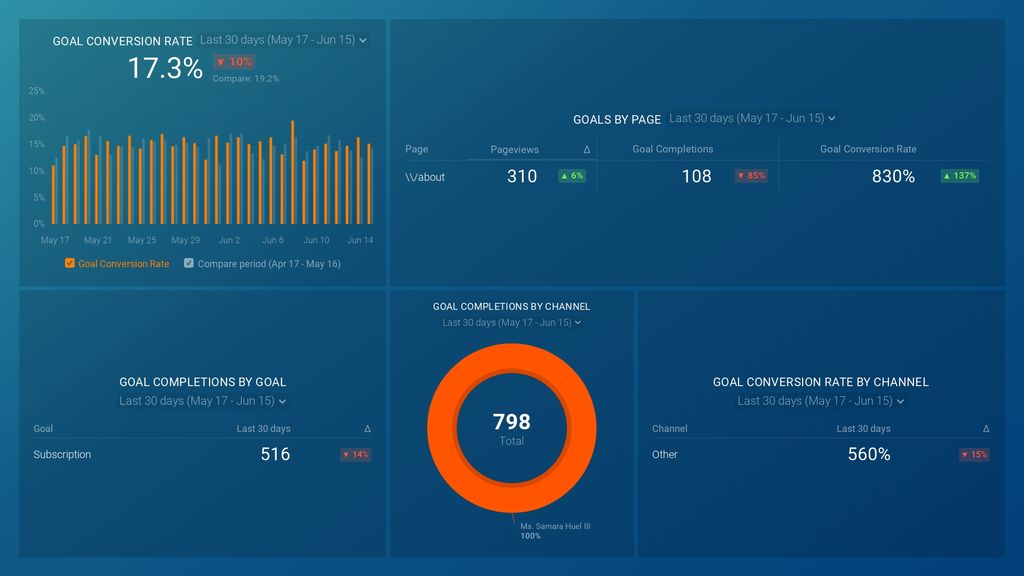
Here is an example of a Goal Completions client report from Databox. This comprehensive Google Analytics Goal Overview Dashboard can help you visualize goal completions and conversion rates.
Conversion Report
If you have switched over to GA4, then the monetization or conversion report can help you show the ROI of your campaigns.
“The most important report from Google Analytics when it comes to client reporting is the Conversion report,” says Andrew Swinney of Verde Strategies. “It goes back to the famous saying People don’t want to buy a quarter-inch drill. They want a quarter-inch hole! Clients want more sales and all other metrics tell the story of how you got there. If you want happy clients that extend contracts, show them how you’re solving their real problem.”
Pro Tip: Your Go-To Dashboard For Doing a Deeper Dive on Website Traffic and Conversion Sources
Struggling to find an easy yet effective way to gain a comprehensive understanding of your traffic sources, user behavior, and revenue generation?
You can do all that and more with our plug-and-play GA4 Acquisition dashboard template:
- Understand user acquisition: See where users come from, tailor outreach, and track new user growth;
- Focus on high-performing channels: Identify top channels, optimize resource allocation, and adjust underperformers;
- Track revenue & engagement: Monitor revenue growth, active users, and the effectiveness of your campaigns;
- Go beyond traffic & conversions: Gain deeper insights into demographics, sales, customer journeys, ARPU, and more;
- Optimize marketing & drive results: Make data-driven decisions to improve your marketing strategy and achieve business goals.

You can easily set it up in just a few clicks – no coding required.
To set up the dashboard, follow these 3 simple steps:
Step 1: Get the template
Step 2: Connect your Google Analytics 4 accounts with Databox.
Step 3: Watch your dashboard populate in seconds.
Mobile Overview Report
Most people are browsing your website from their smartphones these days. So, understanding what pages they are viewing, how long they spend on your site, and the top actions they are taking is essential.
“Perhaps no other Google Analytics report is more important than the mobile overview report,” says Jonathan Zacharias of GR0. “Specifically, this report allows site owners to understand website weaknesses and pain points, and also recommend improvements that can be made for low-hanging-fruit wins.
With the mobile overview report, users will find ways to optimize their mobile shopping experience, speed up their website loading time, and achieve quick wins to increase conversion.”
Here is an example of a GA Mobile Overview report from Databox. GA users can rely on this Google Analytics Mobile vs. Desktop traffic dashboard to visualize how mobile and desktop visitors interact with their website.

Efficiency Analysis Report
If you want to get a better picture of your marketing conversion funnel, then the efficiency analysis report is a report to bookmark.
“The Efficiency Analysis Report report is great for organizing important metrics and revealing the efficiency of each traffic conversion funnel on your website,” says Mike Dragan of Oveit. “The Visitor Acquisition Efficiency Analysis Report displays information such as the number of unique users, total sessions, goal conversion rate, and a number of new users (if any).”
Neil John of One Computer Guy adds, “We have been using the Efficiency Analysis Report for a whole year now and it has improved the way we track our leads. Other than that, we have found that the Visitor Acquisition Efficiency Analysis Report shows the number of unique visitors, total sessions, and new users that have been acquired over the month.”
Browser Report
The browser report allows you to take these insights a step further by tracking visitors and conversions based not only on mobile devices but also on what web browser they are using.
“The Google Analytics browser report is very useful,” says Sheila Chaiban of One Ocean Beauty. “It is helpful when it comes to identifying the technologies used by people who stop by and look through our website at One Ocean Beauty. I also like the fact that the report is great at analyzing website usage in different versions of OS and browsers. This is very convenient and provides us with invaluable data.”
Jeroen van Gils of EcomContent adds, “Being a business owner, the browser report is the best for clients because it allows users to create custom reports that show conversions by browser and divide them by device, such as desktop, mobile, tablet, and so on. This report is very beneficial to clients that sell things on their sites. It helps them in determining where to focus their marketing efforts.”
Referring Pages Report
If you do any co-marketing or link-building initiatives, then the referring pages report can tell you how many visitors are coming from these sources.
Gerrid Smith of Joy Organics says, “In my opinion, Referring pages report is the best Google Analytics report for the clients. The Referring Pages Report is a great way to see how effective or ineffective your link-building activities are. This custom report also helps in the tracking of the most popular links that lead to your website. Similarly, the referring pages report displays the exact webpage from which your links come – not just the website – as well as the average section duration, bounce rate, link quality, per session value, and so on. The per-session value will provide the exact links that produce the desired results.”
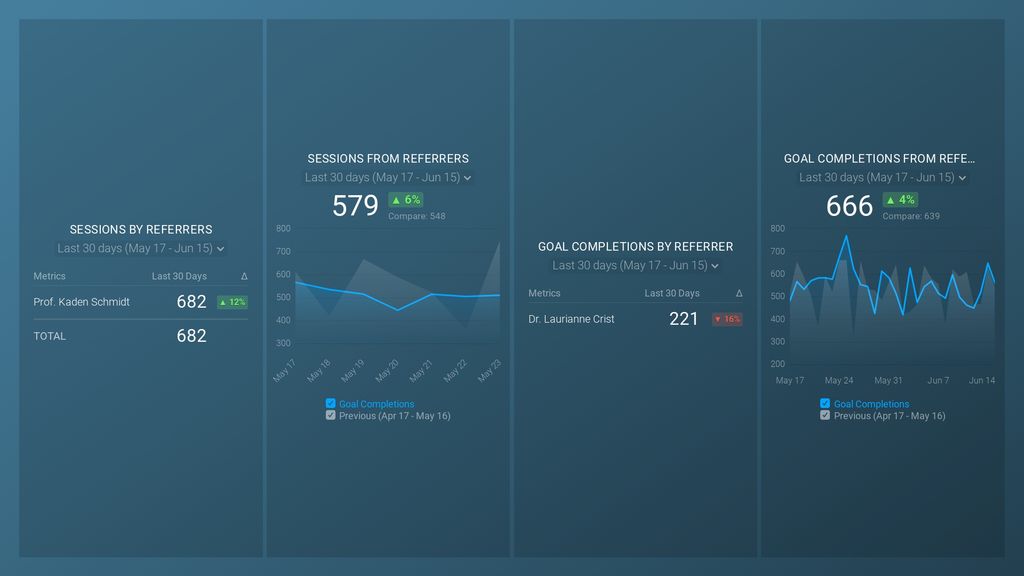
Here is an example of a referring pages report from Databox. GA users rely on this Referrals Overview Dashboard to discover which referral sources drive the most traffic and conversions to their website.
Keyword Analysis Report
The keyword analysis report can help you determine what SEO keywords are driving the most qualified traffic, leads, and/or customers to your website.
“For us, the best GA report for clients is the Keyword Analysis Report,” says Will Ward of Translation Equipment HQ. “SEO is a huge part of our focus, as well as my personal interest, so having access to these key data at all times is a blast. Tracking keyword usage and growth through all metrics consistently provides us with useful, actionable information, but the revenue-related metrics are particularly useful when we need to grab the most important data in a flash. Overall, the ability to constantly monitor and improve our content strategy with the Google Analytics Keyword Analysis Report has provided a significant boost to our conversion rates.”
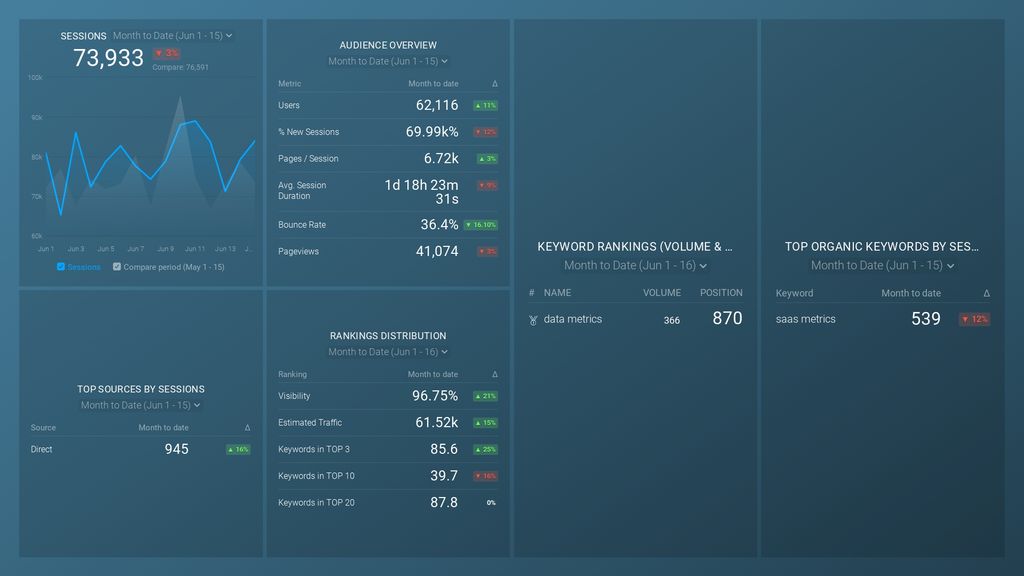
Here is an example of a keywords analysis report from Databox that combines data from Google Analytics and SEMRush. This SEO performance dashboard allows you to see traffic, keyword rankings, and on-page factors that may be impacting organic traffic.
Retention Report
Another reason to potentially switch over to GA4 is to use the retention report, which allows you to display all of your new vs. return users alongside retention, engagement, and lifetime value metrics.
“I’ve been using Google Analytics 4 for a while and I love the Retention report GA offers because it allows me to quickly show my clients the quality of traffic we’ve helped them acquire in the past month or quarter,” says JP Zhang of SoftwareHow. “The Retention report is super simple. On the top, you get the number of New Users and Returning Users. Below, you’ll see specific metrics like User Retention, User Engagement, and Lifetime Value. For example, one of my clients’ websites has gained 16K new users and 3.4K returning users during the past 28 days. That’s 17.53% in returning rate, which is a decent metric compared to the industry average. By looking at the Retention report, we are able to show our clients that the traffic we’ve helped them acquire is quality traffic that converts.”
Customer Acquisition Report
Speaking of GA4, another useful report is the customer acquisition report. This speaks to where you are acquiring customers/visitors.
“Customer Acquisition Report is the most significant Google Analytics report as customer acquisition is the top priority for most clients,” says Hamna Amjad of Efani. “It includes data such as Sessions, Bounce Rate, Revenue, Conversion Rate, etc. It allows in-depth analysis of the interactions that users have with the client’s website, offering a deep understanding of customer behavior. It shows where customers are coming from and what channels are generating more revenue. You can identify those channels that are lagging behind and tweak them to improve their performance.”
Here is an example of a customer acquisition client report from Databox. Google Analytics 4 users rely on this Acquisitions Overview Dashboard to dig deeper into their traffic sources, monitor user behavior, and keep an eye on how it all impacts revenue.
Location Report
Another key report is the geography/location report which can tell you where your visitors are located.
“One Google Analytics report that can be used for clients is Audience >> Geography >> Location,” says Tim Absalikov of Lasting Trend. “If you want to know where your customers come from to make decisions about optimizing advertising campaigns, website development, and mailing lists, you need this report. The following basic parameters are available in the Location report: • Country. • Town. • Continent. • Subcontinent. By default, the report shows a map of the world. Color saturation shows the proportion of sessions from different regions. In addition, the report has a Statistics tab.”
Channels Report
What percentage of your traffic is coming from organic search vs. social media vs. paid ads? This is just one question that the channels report can answer.
“One of my go-to reports in any situation is the Channels Report,” says Emily Appelbaum of Family Destinations Guide. “You can find it under acquisition then all traffic channels. This report is awesome on so many levels.
First, this will reveal how your traffic is different depending on the channel. So for example, if they come from an organic search like Google or maybe paid ads or perhaps other websites referred your page, the cool thing about this report is that you can see the three most important report types in one overview, that’s acquisition, behavior, and conversions.
Acquisition answers how the user came to your website, Behavior tells you what they did there and Conversion tells you if they bought or finished the goal that you’ve set up.
Just note that you can always change the view from conversions to goals from its dropdown. One of your goals might be to be smooth then you can choose that one. I always compare with the previous period like the last month or last year. You can add it in the date section and then at the bottom you’ll be able to see if the trend is going up or down. Overall, this google analytics report is really helpful and easy.”
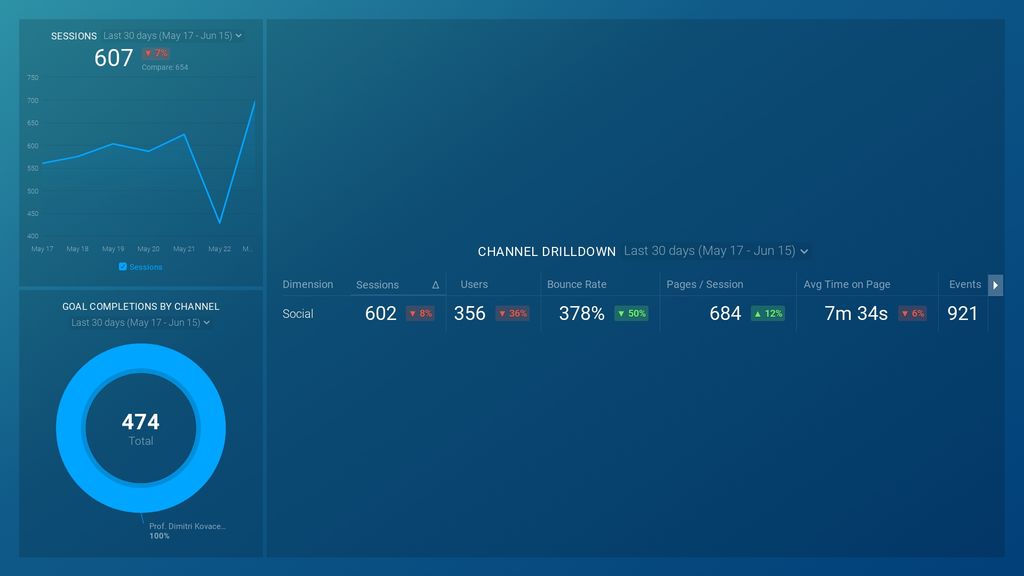
Here is an example of a channel report from Databox. Marketers use this Google Analytics Channel Overview Dashboard to compare the performance of their top acquisition channels with ease.
Source Medium Report
If you are looking to dive a little deeper than the channels report, then you can filter by source/medium.
For example, Jeff Michael of Local Light Marketing says, “The one report clients want to see each week is the traffic/sales report for each source/medium/campaign. This helps them to see how well their site is not only performing in organic or paid search, but also for any campaigns they launched that previous week. This report is normally sent to my clients every week on Friday. It’s something they actually read and respond on.”
Patrick Kurowski of MarketKeep agrees, “The most important Google Analytics Report for any small business owner is their source/medium report. Any marketing strategy relies on multiple funnels to drive traffic to their website. The source medium report within Google Analytics tells you where users come from, when they entered their website, what actions they took, and whether or not that action led to conversion.
Taking a closer look at the report itself, the source will tell you the original location that your traffic originated from. Hence the name source. This could be from a search engine like Google, a social media platform like Facebook, or an email campaign that you recently launched. A direct source means that someone typed your URL directly into their website browser to visit your website. The medium is how they got there. This could be organic, through a Google Adwords campaign like a search or display campaign, or a referral link via another website.
Further, into the report itself, you will have access to valuable insights such as behavior data, conversion data, and acquisition data.
At the end of the day, the source/medium report will show you exactly where your website traffic is coming from, the behavior that your user is taking, and any conversion activity. By looking at this report you can help yourself make crucial decisions like where you should devote more of your time, energy, and marketing budget based on what you find inside this report.”
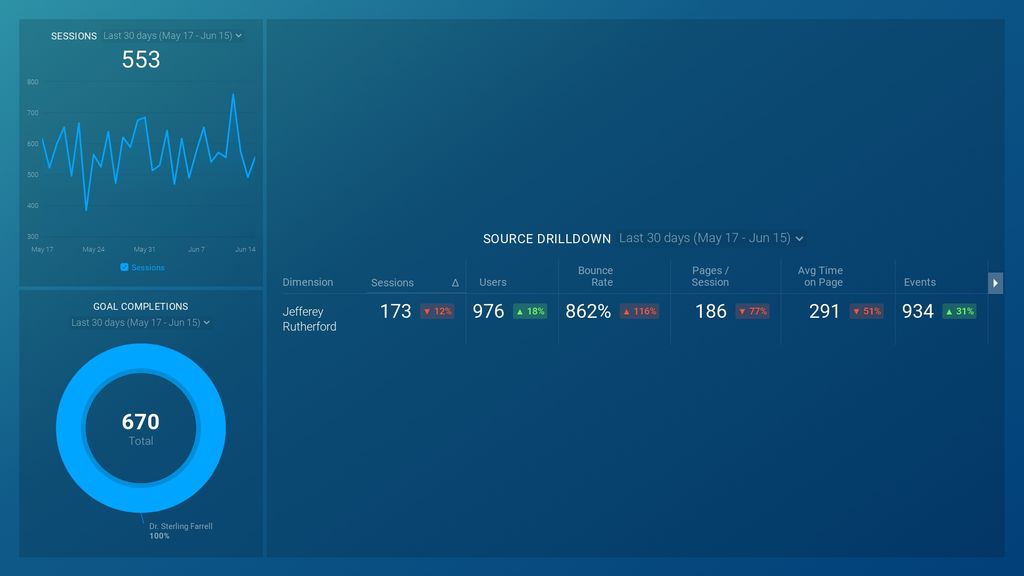
Here is an example of a source medium report from Databox. This Google Analytics Audience Drilldown Dashboard allows you to filter your traffic by source/medium and monitor conversions and bounce rate.
Site Speed Overview Report
With Google’s recent algorithm updates including making Core Web Vitals a ranking factor, site speed is increasingly important.
“This report reveals which pages on your website are loading far too slowly, whether due to giant images, too many plugins, or a number of other technical issues,” says John-Paul Cody of Trends & Tactics. “This is a big deal, because when a page loads too slowly, users press the back button more frequently, which means less revenue for your business. Plus since page speed is an element of Core Web Vitals, not paying attention to this report can result in lower website rankings in search engines as well.”
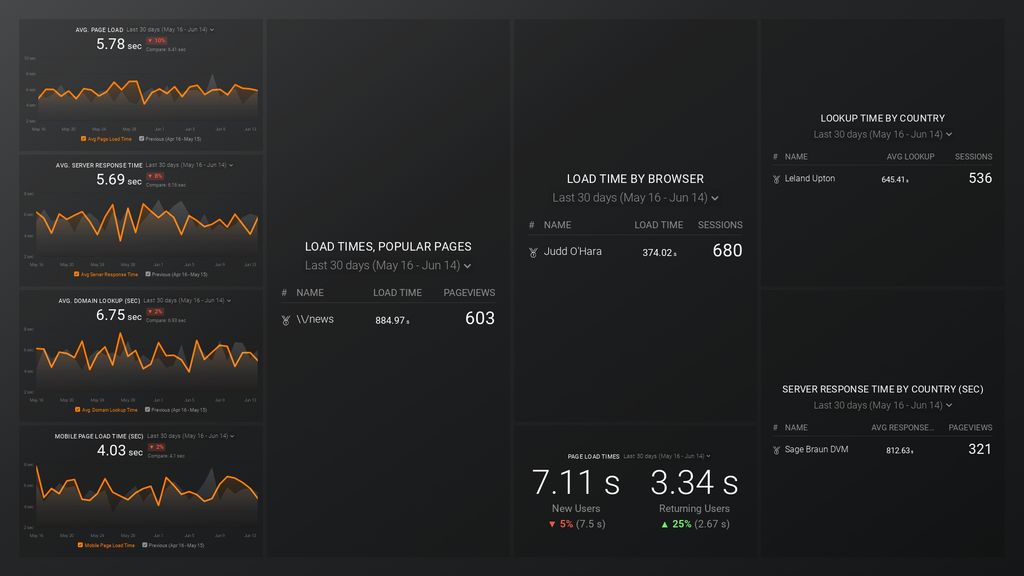
Here is an example of a site speed overview report from Databox. Marketers rely on this Google Analytics Site Performance Dashboard to measure their website response and load time metrics that impact SEO and UX.
Google Ads Report
If you are running paid ad campaigns, then the Google Ads reports are key to ensuring that you are maximizing your investment.
“The Google Ads report is the best choice for me,” says Robin Brown of Vivipins. “AdWords Conversion Report contains a number of helpful data points including bounce rate, revenue per visitor, average order value, conversion rate and time on site. The Dashboard Summary report shows a plethora of section summaries that include everything from Ad impressions to Landing pages. This report also combined with a Google Analytics account can hold up nicely in competition with most outside analytics platforms.”
Here is an example of a google ads report for clients from Databox. PPC experts rely on this Google Ads Campaign Engagement Dashboard to track campaign efficiency and monitor top-performing keywords.

Average Time on Page Report
This report is particularly important for affiliate and content sites.
“One metric we always try to show clients is the ‘average time on page’ for their money pages,” says Jake Peterson of Atiba. “Many times, clients haven’t gone down the right route when it comes to making an effective landing page. We also put tracking metrics on certain money pages to see how far down people are scrolling. It’s kind of like the poor man’s version of HotJar as we can see if users are truly interacting with their pages or not.”
Average Time on Page is a metric that helps you better understand the quality of your content, whether you’re attracting the right type of traffic or if there are any technical issues in place. Watch the following Data Snack if you want to learn more about:
- How to visualize a variety of visitor engagement metrics, including Time on Page and Dwell Time
- How to analyze Time on Page and Dwell Time on a longer time scale
- How to see and analyze load times for your most popular website pages
Path Length Report
Another report you might want to use is path length, which can help you learn more about your buyer journey.
“One Google Analytics report we often use is the Path Length report,” says Sasha Matviienko of Viien. “It gives you a good understanding of how long it takes for consumers to go from the first site visit to purchase. This way, it’s easy to organize your marketing efforts, because you know that if a customer doesn’t buy within X days, they won’t return again.”

In sum, these are the most useful Google Analytics client reports. The specific reports that you rely on will depend on the type of business and your specific sales and marketing goals.


