Table of contents
As a content marketer, it’s important to track metrics that prove your efforts are working. But it’s also important to track metrics that help you improve.
To prove your content is driving results for your company or clients, you track all of the go-to metrics for measuring content success highlighted in this report.
What’s interesting is that in this report, more than 60% of marketers surveyed ranked “leads” as the most important KPI for measuring the success of their content marketing program.
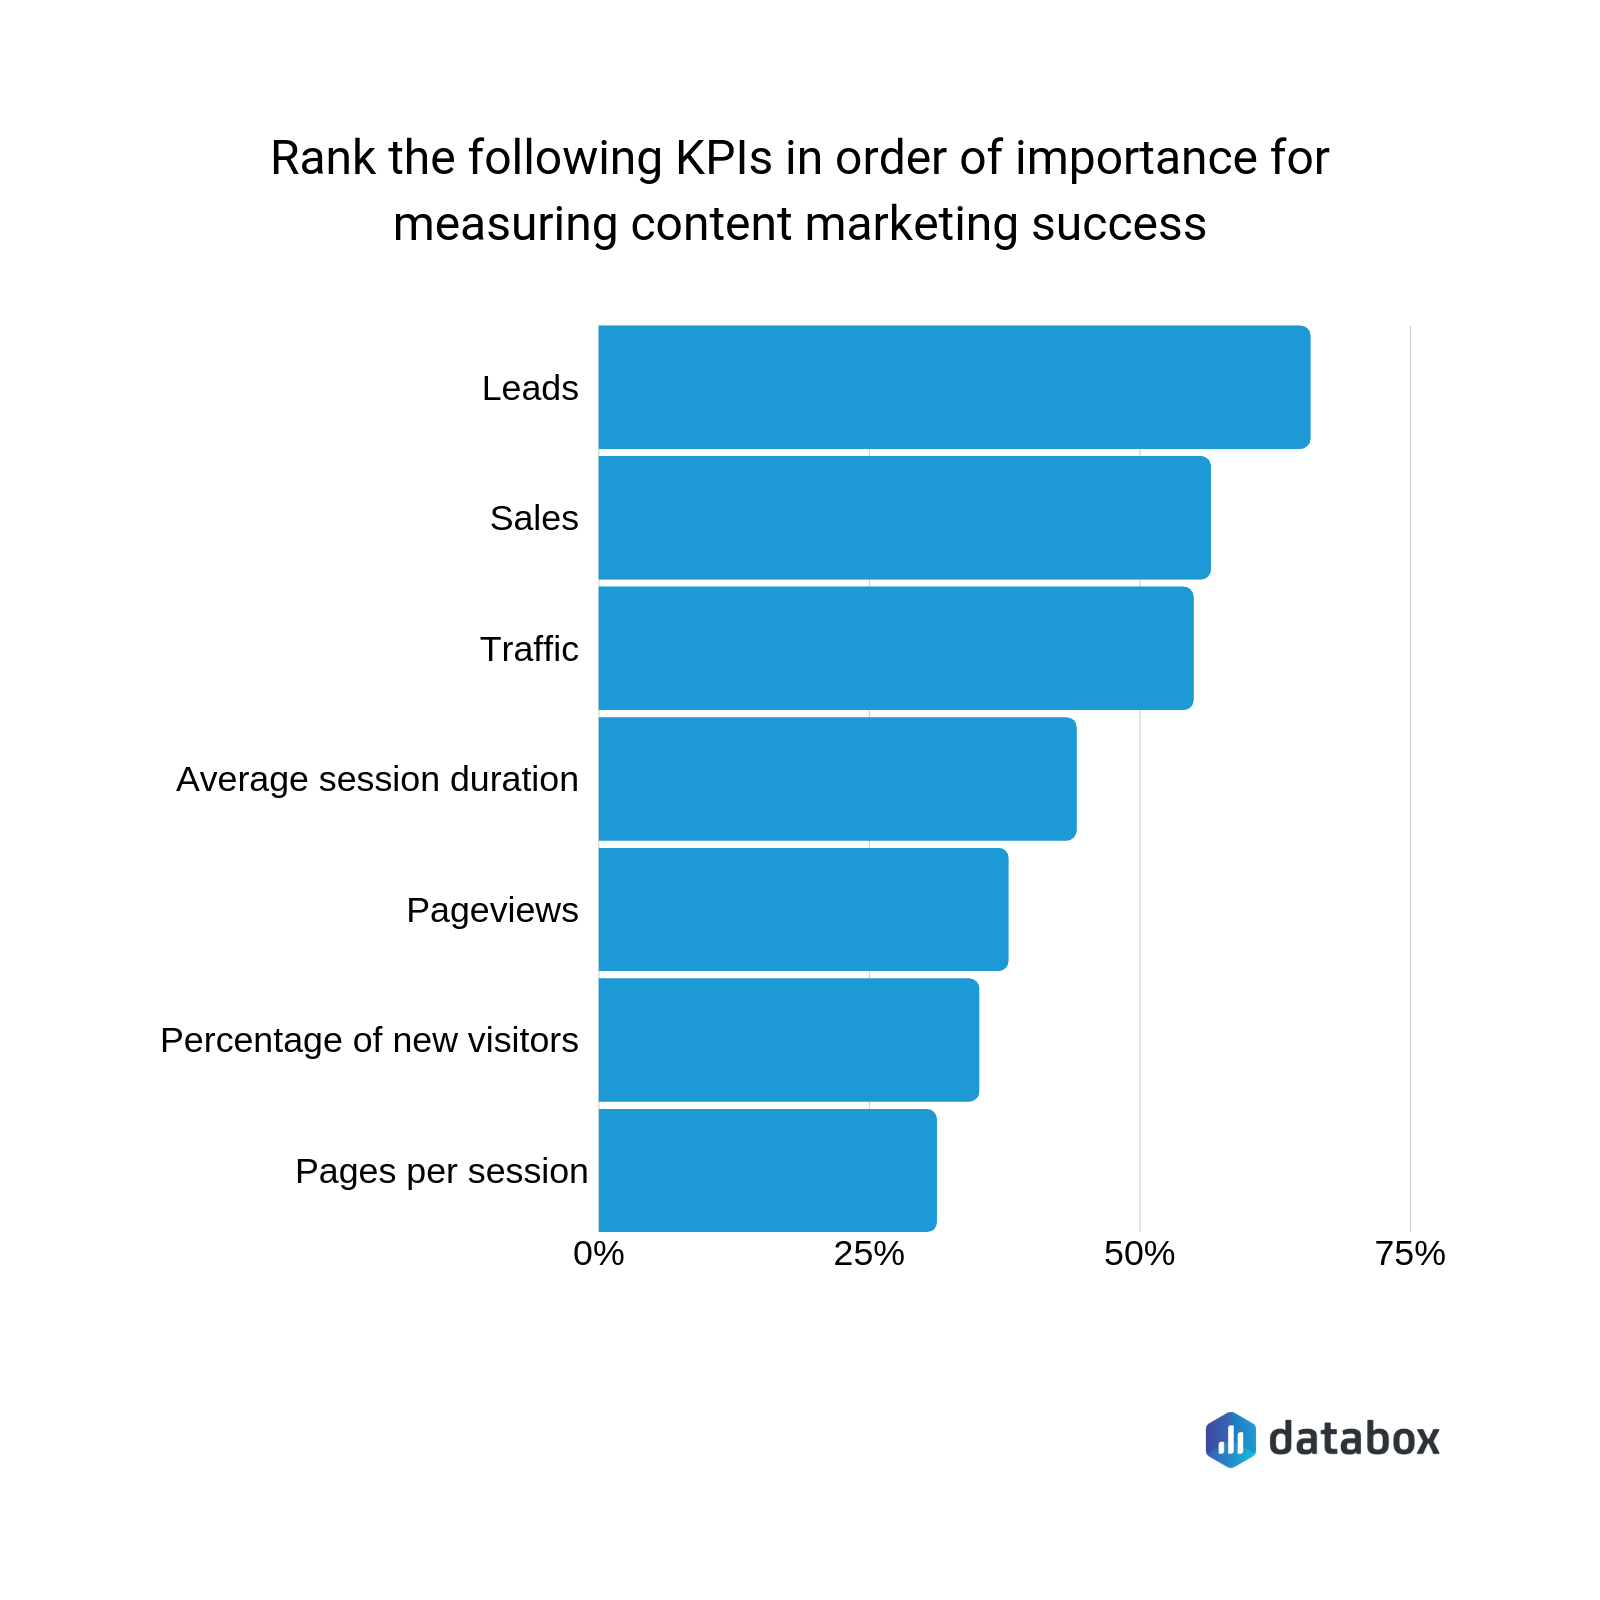
What does this mean? While these metrics paint a picture of how your content marketing efforts are succeeding overall, they don’t always give you the granular data you need to discover what specific content, campaigns, channels, and efforts are most effective in driving value.
To really improve you need to track more granular pieces of data with the help of a marketing dashboard software .
Not sure where exactly should you dig deeper?
To uncover some of the more unique content marketing metrics, we asked 40+ marketers to share their thoughts on the most overlooked metrics and KPIs for measuring content.
As a result, we identified 17 metrics you can track to measure and prove content marketing ROI when the go-to metrics don’t provide as much detail as you need.
- Organic Traffic ROI
- Assisted Conversions
- Sales Cycle Velocity
- Customer Sentiment
- Pipeline Contribution
- CTA Conversion Rates
- New Contacts/Relationships
- Customer Lifetime Value
- Lead to Conversion Rate
- Lead Scores
- Qualified Visitors
- Page Value
- Attribution
- Exit Rate
- Number of Ranking Keywords
- Mobile Entrances
- Repeat Visitors
If you’re tracking traffic but aren’t sure how to translate that into generated revenue, tracking leads but aren’t sure how many of those leads turn into sales, or tracking conversions but aren’t sure how often the catalyst for those conversions was content, these metrics may help.
Let’s dive in.
1. Organic Traffic ROI
“Our clients often ask how to calculate the ROI of organic traffic,” says Anna Wolf of SuperScript Marketing. “We do this in two ways.”
“First, we calculate what it would cost to drive the same amount of traffic using paid search; we multiply the average PPC of traffic-driving keywords by the number of organic clicks.”
“Second, we work with clients to place a value on content-driven conversions (for example, registering for the site).”
“Using simple math, if—on average—10% of site registrants go on to buy the product for $1,000, the value of each registrant is $100. Multiply that by the number of organic clicks that ultimately led to a site registration, and there’s your ROI.”
PRO TIP: Measure Your Content Marketing Performance Like a Pro
Struggling to track the impact of your content across platforms? We feel you. Thanks to Databox, fragmented data doesn’t have to hold you back anymore.
Our library of free content marketing dashboard templates puts all the insights and metrics you need in one place. No more jumping between reports!
Measure engagement: Track key metrics like likes, comments, shares across social media platforms to see what content resonates most with your audience. Analyze website traffic, bounce rate, and average time on page to understand how visitors interact with your content.
Optimize conversions: Identify high-performing landing pages and blog posts that drive the most leads using dashboards like HubSpot Marketing Lead Source. Analyze campaign performance and user activity for both organic and paid content with a Facebook Pages & Facebook Ads dashboard.
Improve SEO: See which pages rank highest in search results and drive the most organic traffic. Improve search visibility by visualizing key SEO factors like backlinks and domain rank.
You can easily set it up in just a few clicks – no coding required.
To set up a dashboard, follow these 3 simple steps:
Step 1: Choose a fitting template
Step 2: Connect your data
Step 3: Watch your dashboard populate in seconds
2. Assisted Conversions
“Given that our content marketing campaigns include a wide variety of tactics—including distribution of free content, paid traffic acquisition, social media, and link building—we like to look at Assisted Conversions in Google Analytics as an interesting way to track our activity,” says Kris Hughes of ProjectManager.com.
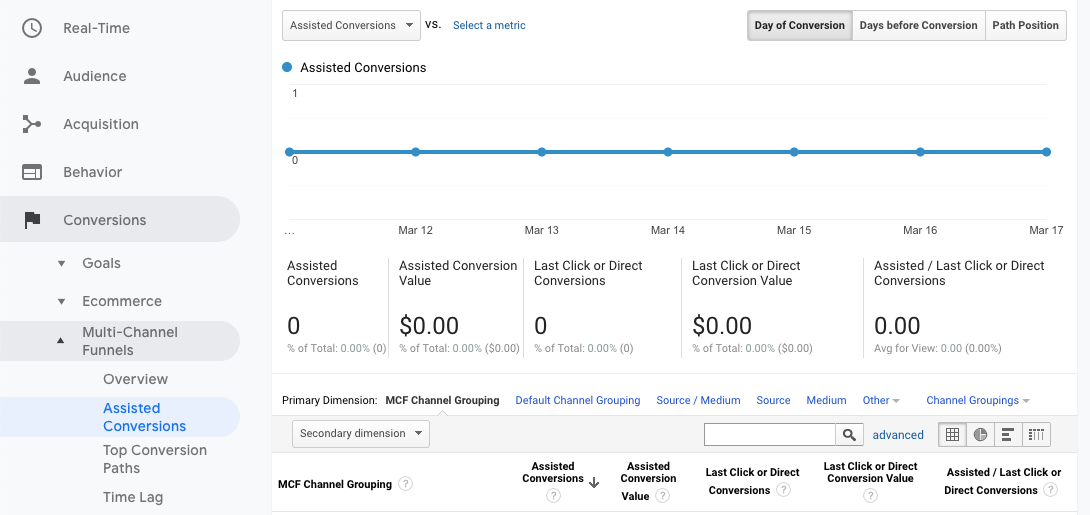
“Assisted Conversions show us which channel(s) typically lead to trial signups of our software immediately after being visited (i.e. an assist). The closer the value of the medium is to 0, the more likely it is on average to lead to an assisted conversion.”
“Anything around 0.2-0.4 is doing a great job of leading to conversions after visits. Along these lines, organic search traffic at 0.32 is our best-assisted converter. People who visit one of our articles from search are the most likely to then sign up for a free trial.”
“This KPI flies under the radar typically—especially if your focus is on direct conversions and not seeing how a conversion took place—but nonetheless is very valuable and a unique way to measure and evaluate each of the mediums within your overall content marketing strategy,” Hughes says.
Helpjuice’s Josh Brown agrees: “Assisted Conversions give you a better picture of how well your content helps support customers through the customer journey by showing how specific pages led customers to ultimately convert.”
“For example, a user might land on your website by finding a particular piece of content via Google and then bounce. Two days later they land on your website again from social media. Finally, they come back the next week—this time directly—and convert.”
“With an assisted conversion model, each of these two pieces of content gets partial credit for the final conversion (up to 90 days).”
“This is especially important as content is meant to target and support leads throughout the funnel; a lot of times it can be hard to quantify the value of top-of-funnel content if only using a last-click view of conversions.”
“This all allows content efforts to be tied to ROI more easily than some other important—but soft—content marketing metrics like brand awareness,” Brown says.
3. Sales Cycle Velocity
“Frontline numbers like traffic and pageviews matter,” says Scribewise’s John Miller, “but we find that an important KPI is sales cycle velocity.”
“There are obviously many factors here, but a strategic approach to content marketing plots content along the buyer’s journey. If you have high-quality content that builds trust along the way, you should be able to reduce the time to sale.”
“Tracking this requires sales team members to catalog when the first contact occurs, as well as tracking the average time to sale across the organization.”
4. Customer Sentiment
“Content marketing draws its core success principles from a basic philosophy of public relations, which is all about reputation,” says Ben Van Loon. “Measuring this starts with sentiment: knowing how your customers feel about your content and your products.”
“You can assess this both quantitatively and qualitatively through various social media monitoring tools, as well as determining the overall tonality of sentiment using your gut instinct as a content marketer.”
Lightbulb Media’s Lewis Kemp agrees: “The vast majority of brands we help completely overlook the importance of social listening. Some aren’t aware of it at all.”
“If you want to know what your customers truly think of your business, you need to be monitoring what they say to their friends/followers in their own social circles.”
“It’s such a valuable marketing tool that allows to you directly address the successes or failures of your current offerings—and drastically increase your customer sentiment and brand advocacy,” Kemp says.
5. Pipeline Contribution
“Even if we’re creating top-of-the-funnel content, at some point, we want some of these people to become customers,” says ServiceRocket’s Bill Cushard. “And we know anecdotally that many do. But more content marketers should track the contribution that content makes to the sales pipeline.” You can easily do so with these free content marketing dashboard examples.
“Using the campaign feature in most marketing automation tools and/or CRMs, marketers can track how content like ebooks and webinars contribute to a sales opportunity being created.”
“We found for our company during a roughly two-year period, webinars alone contributed to 14% of the total pipeline. We don’t think the webinars were the only thing making that 14%, but we did believe from the data that the webinars were the major piece.”
6. CTA Conversion Rates
Blake Hawksworth of Creditplus recommends: “One of our priorities is measuring CTA conversion rates. CTA conversion rates are usually a good indicator of whether content is relevant, engaging, and persuasive.”
Related: 13 Ways to Convert More Blog Traffic to Customers
7. New Contacts/Relationships
“I recommend tracking new relationships,” says RobertsonComm’s Scott Robertson.
“Marketing is the relationships business, so we must measure relationships. And if we do that, we’re less likely to do annoying things—excessive retargeting, publishing blog posts that are not interesting or useful to our audience, spam, sponsored posts, awful emails—that will destroy relationships, too.”
Ironpaper’s Brian Casey offers a method for tracking new contacts and relationships: “We categorize all of our blog CTAs as a singular HubSpot campaign to monitor how our blogs are driving new leads as the initial touch point.”
“By using blogging as a campaign, you have access to more metrics than you would just by looking at the analyze tab on blogs. You have access to metrics such as ‘New Contacts (First Touch)’ and ‘Influenced Contacts.’”
“These two metrics allow you to look at the business value of content marketing and determine how effective your blogging strategy is in creating new contacts.” Moreso with this marketing automation dashboard you can easily track both metrics in real-time.
8. Customer Lifetime Value
“One of the most important metrics to know is the lifetime value (LTV) of a customer,” says Allan Luu of Sure Systems. “This is how you are able to dictate whether or not a campaign is profitable, and it also gives you the dollar value of leads, opt-ins, a social media follower, etc. to help quantify your marketing efforts.”
“In my experience, people don’t have this data, and they don’t go back to try and figure out exactly how much a client or customer is worth to them. And people often times are just spending money blindly online without ever knowing whether it’s profitable or not.”
9. Lead to Conversion Rate
“One of the most overlooked content marketing metrics is lead to conversion rate,” says Chloe Bennet of Academized.
“Marketers often overlook this metric because they consider their job done as soon as they pass a lead on to sales. But if you want to have a successful campaign, you should strive to track this metric as well.”
“If none of your leads converted, can you really say that your campaign was successful? Some of the blame can be passed on to the sales team, but they can’t do much if the lead wasn’t ready to convert.”
10. Lead Scores
Most marketing automation and CRM tools offer a lead scoring feature, and Perryn Olson of My IT believes it’s just as helpful for marketing as it is for sales.
“You can individualize a buyer’s journey with lead scores by determining where they’re at in the decision-making process. Additionally, you can pinpoint which prospects are most likely to buy so your sales team can focus their time appropriately.”
This is important to track because generating leads is just one side of the coin, it is also important to assess the quality of the leads generated as a result of the content you put out.
11. Qualified Visitors
“We track a metric we call ‘addressable returning visitors,” says Chris Mechanic of WebMechanix. “For us, addressable means U.S.-based visitors who visit key product and service pages.”
“You can track this metric in Google Analytics by building an advanced custom segment. The reason this is important is that it demonstrates the extent to which you can take top-of-funnel blog readers and move them deeper down in the funnel—and the extent to which you can keep them coming back to your site.”
12. Page Value
“Page Value is a built-in metric in Google Analytics that measures the transaction value or goal value divided by the unique pageviews of the content,” says Joonas Jukkara of SEOSEON Europe S.L. “In other words, it gives you the average value of a page that a user visited before making a purchase or contacting you.”
“For a non-e-commerce business, you just need to remember to define your contact form as a Google Analytics goal and give it a numerical value. This value can be calculated as an average deal value times your average lead conversion rate.”
“Page Value can be accessed through Google Analytics > Behavior > Site Content > All Pages. Remember to filter out all product, category, cashier, and tag pages so that you’re only looking at the effectiveness of blog pages or other informational pages.”
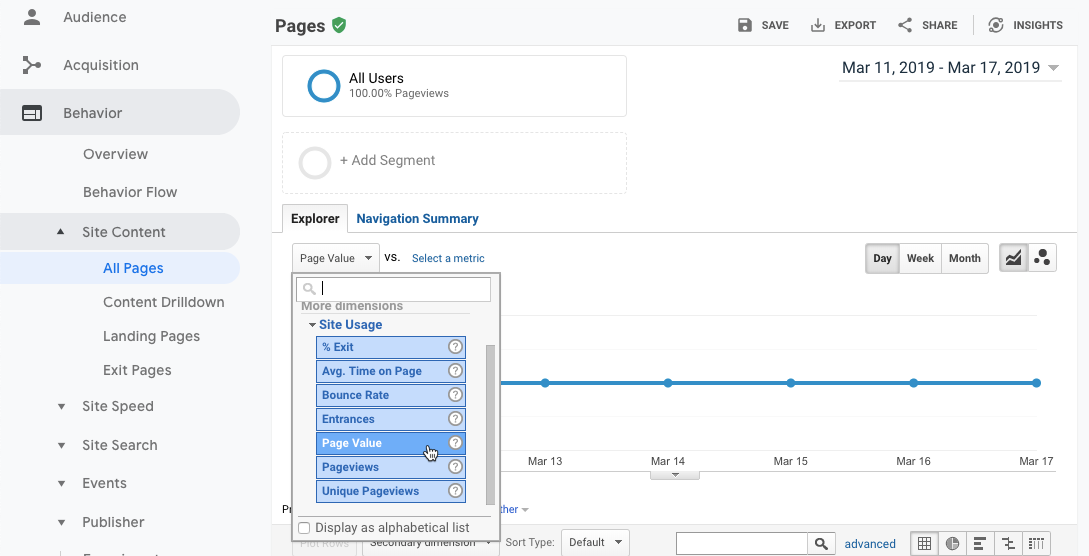
“I would benchmark this against the Page Value presented on product pages. This gives you an idea of how profitable it is to drive traffic (paid or organic) into a product/service page compared to other content.”
13. Attribution
“Monitoring attribution lets you understand which channels assisted in the consumption of your content so you can create content with those channels in mind,” Ajay Prasad says.
Roger West’s Diane Callihan agrees that tracking attribution is key:
“In today’s omnichannel era, we have a wide range of content marketing channels—paid search, display, retargeting, social media, email campaigns, in-store promotions, direct mail, and more. And you may be simultaneously running different campaigns across those channels.”
“When you finally get a lead or a sale, what campaign/channel do you attribute it to? The answer may not be as easy as it seems, but it’s important to find out.”
14. Exit Rate
“Exit rate is definitely an underutilized metric,” says Commusoft’s Cristina Maria. “It shows you the percentage of people who entered your website via one page and left directly after reading it.”
“When you build a content strategy, you need to build it around multiple pieces of content, all connected by a topic. This ensures that visitors who reach your site spend as much time as possible there.”
“And sure, time on page covers that, but it can be a bit deceiving as that particular piece of content might simply be longer than others or more difficult to follow.”
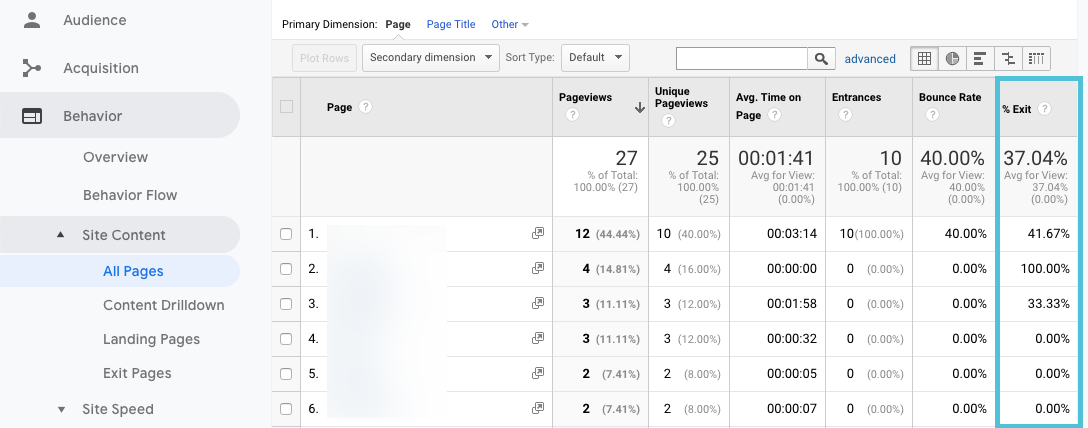
“A low exit rate proves that the related content or your CTAs were successful in taking the reader to a different page, giving you more points of interaction which can be used to qualify them further,” Maria says.
Ajay Prasad agrees: “Almost everyone cares about what pages are driving the most traffic, but very few people track where users are exiting the site. Identifying which pages are dropping off most users is an opportunity to learn what pages need to be revised.”
15. Number of Ranking Keywords
“The most overlooked metric seems to be the number of keywords that start ranking in Google for any piece of content—or for the whole blog/site in general,” says ContentFly’s Annika Helendi.
“Google rankings are some of the most informative and crucial KPIs for content marketing,” says Niles Koenigsberg of FiG Advertising + Marketing. “If you’re not checking your Google rankings consistently, you’re missing out on huge opportunities to improve your digital marketing efforts.”
“Checking your Google rankings shows you how your content compares to other websites and how your content shows up in search queries, which will help you understand how searchers may view and interact with your content.”
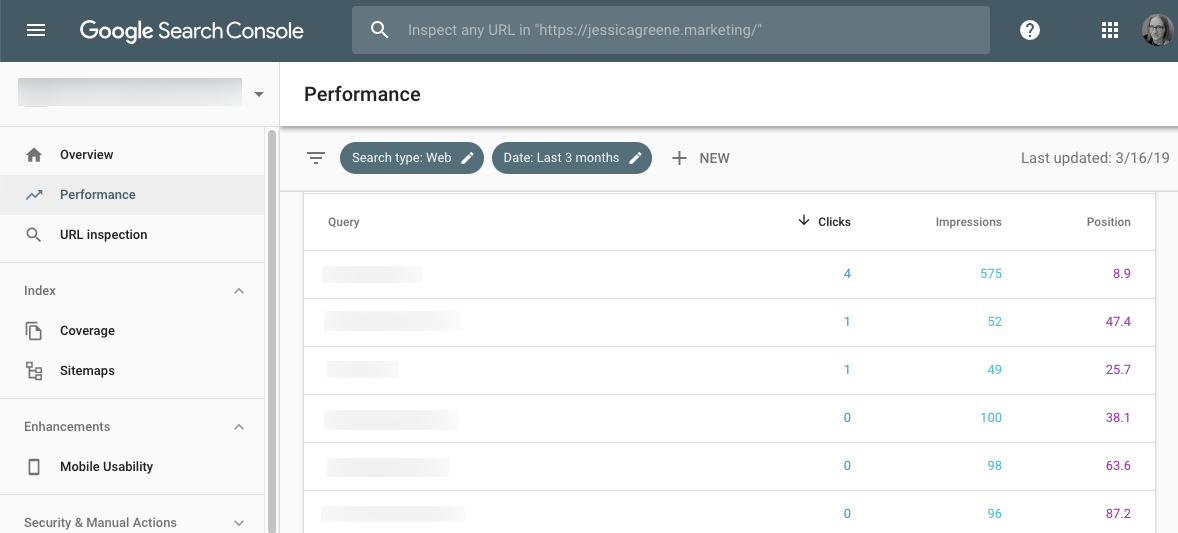
“The rankings can also highlight other keywords that can boost your rankings and make your content more visible to your target audiences. Once you include those extra keywords in your content, it becomes far easier for your content to be found by more people, thus widening your reach and improving your visibility,” Koenigsberg says.
16. Mobile Entrances
“Everyone knows that mobile optimization plays an important role in content marketing,” Ajay Prasad says, “yet very few people actually optimize their content for a better mobile experience.”
“Measuring mobile entrances lets you learn what percentage of your total users entered a particular page on your website using a mobile device.”
17. Repeat Visitors
Iconic Genius’ James Marques says is repeat visitors: “The more you know about how many times your content is being seen by the same people, the quicker you can change it up and keep people engaged.”
So, if you have a high bounce rate and a high frequency, it doesn’t necessarily mean that your content is poor or underperforming. It might mean that you have repeat visitors who come to view your new content every time you publish.
Choosing the most relevant metrics to track in your marketing dashboard is a significant step in improving your content strategy. Depending on your industry and where you are in your content marketing process, some of these content marketing metrics you might be overlooking can make all the difference in helping you measure the effectiveness of your content marketing efforts.


