Introducing the Skills Marketplace: AI analyses on your data, with expert judgment built in
The questions teams want answered, and what gets in the way Every team we talk to has a running list of questions they wish they ...
Sign up now and experience first-hand the future of data analytics.


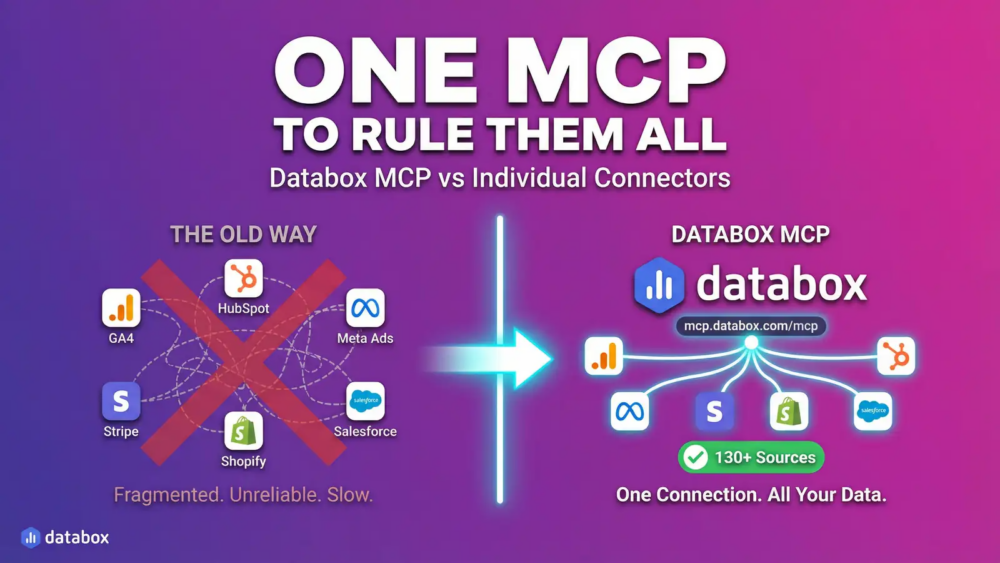
HubSpot’s MCP connection gives Claude real command of your CRM, from deal lookups to record updates. What it cannot hand over is your business context, ...
 by
|
Jul 24
by
|
Jul 24
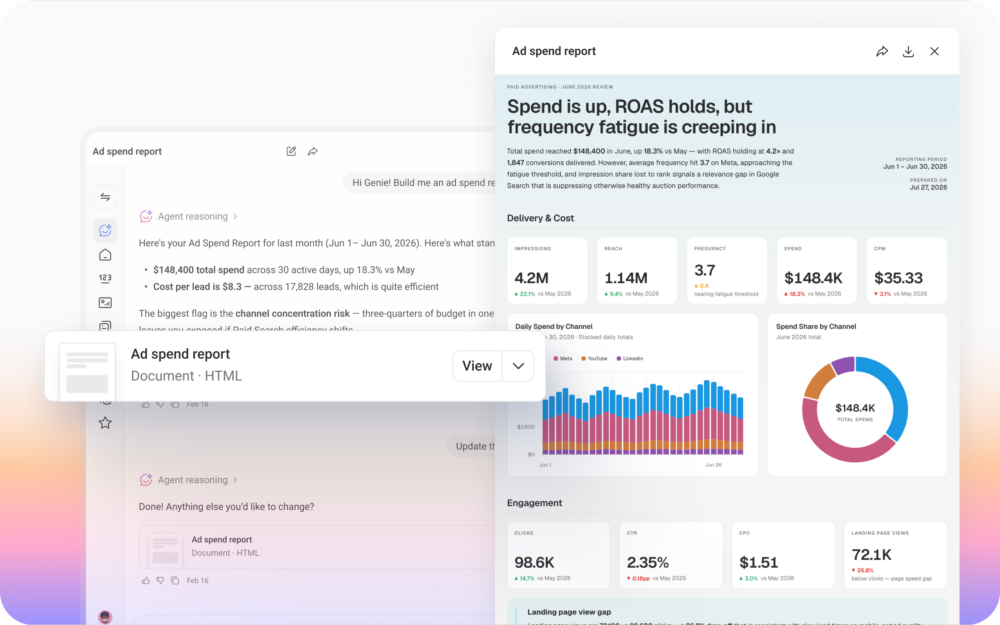
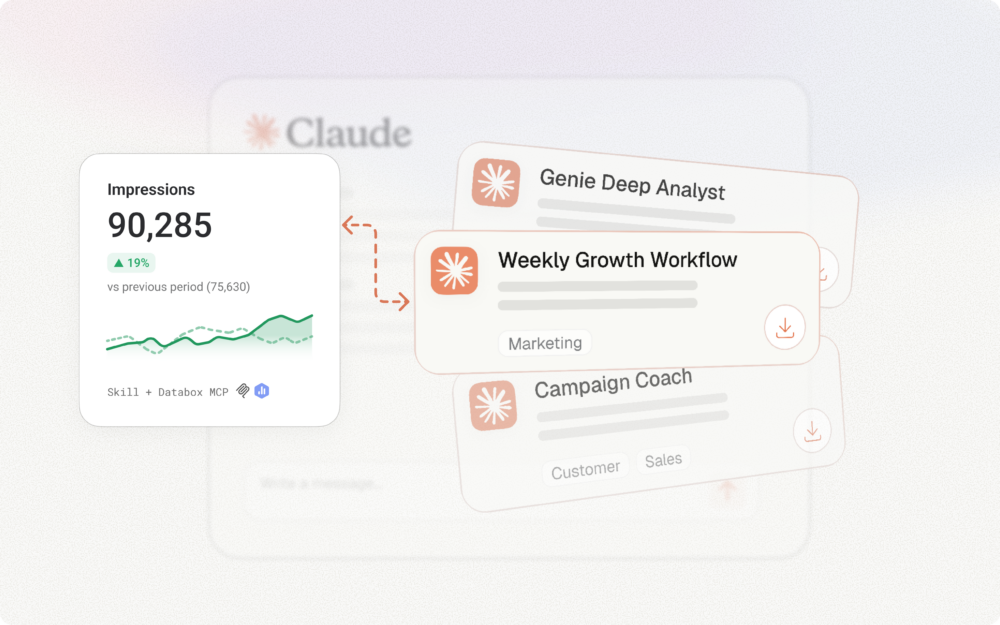
Getting an answer from your data has never been faster. Turning that answer into something you can share still takes hours. Genie, our AI Analyst, ...
 by
|
Aug 3
by
|
Aug 3

Four capabilities, what each one requires from your data, and the test that tells you whether you can act on the output. TL;DR An AI ...
by
|
Jul 24
“Why can’t you do this without the Databox MCP? Because you’re not going to get it. I tried it. It doesn’t work.” — Rick Kranz, ...
 by
|
Jul 30
by
|
Jul 30

Automated briefs earn their keep by preserving judgment quality at the moment a decision has to happen. They don’t just save time; they surface patterns ...
by
|
Jul 24

Every tool in your stack now has AI inside it. The questions that move your P&L live between them. TL;DR Almost every tool in your ...
by
|
Jul 24

The pipeline is in the CRM. The forecast isn’t. TL;DR Your AI tool is connected to Salesforce. You ask: “What’s our realistic Closed-won revenue for ...
by
|
Jul 24

TL;DR Ask a Marketing Lead how the quarterly plan actually gets built. Not the strategy, the mechanics. The answer, in most teams, is a spreadsheet: ...
by
|
Jul 24

Shopify’s MCP servers give Claude real command of your store, from storefront conversations to bulk product updates. Analytics is the one job they were never ...
by
|
Jul 24