Table of contents
At Weidert Group, we know that the success of any agency-client relationship hinges on one thing: results. And results only matter if they’re clearly understood, tied to goals, and used to guide decisions. That’s why our approach to client reporting isn’t just about sharing data — it’s about delivering transparency, building trust, and aligning around what matters most.
We’ve tried a lot of reporting tools over the years. We used to spend hours pulling data from different platforms, copying and pasting charts into slides, and writing manual insights. It was time-consuming and, frankly, exhausting. Databox changed that for us.
In this post, I’ll share how we use Databox to streamline reporting, make performance management easier, and give clients “on demand” access to the information they care about most.
How Client Dashboards Simplify Performance Reviews
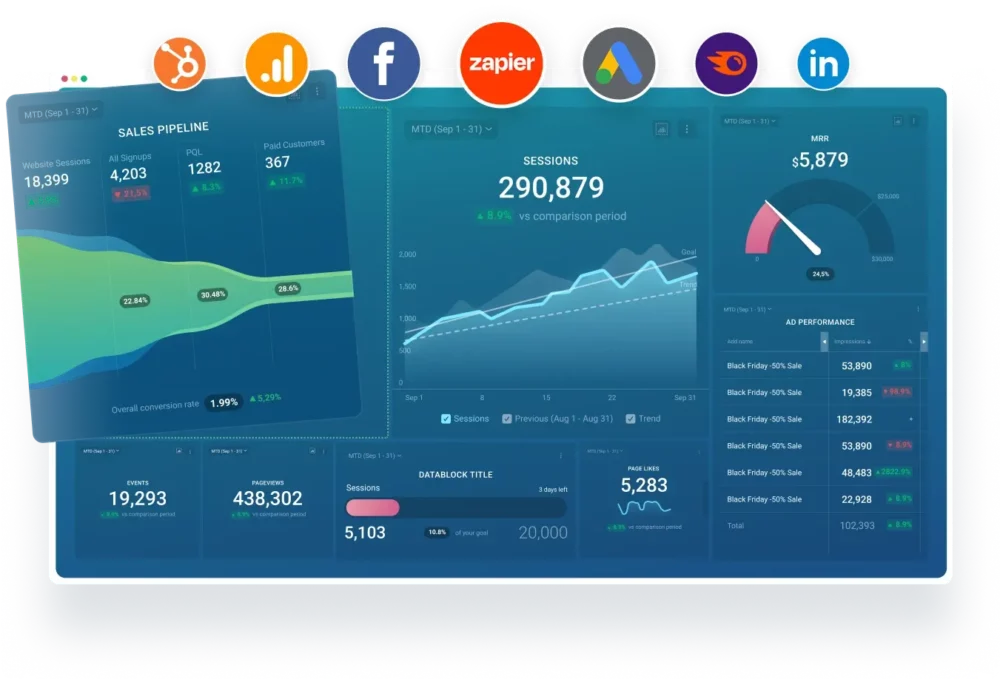
We build customized Databox dashboards for each of our complex B2B clients, tailored to their unique goals and KPIs. Whether we’re tracking qualified leads, website engagement, or paid ad performance, these dashboards give us a real-time view of what’s working and where we need to dig deeper.

These dashboards include the data our strategists and clients need to make decisions. We often use them live in status calls, pulling up the shared link and walking through performance in real time.
Even better? We don’t have to chase down numbers from five different sources. Everything updates automatically.
Tying Performance Data to Strategic Goals
For account strategists and marketing leaders, visibility into performance is essential — not just for tracking KPIs, but for driving outcomes that align with business goals.
One of the challenges in reporting is not just tracking what happened — it’s showing how that compares to where we’ve been and where we wanted to be.
Databox has rolled out features that help us do just that:
- Goal lines can now be added to metric blocks, so we’re not just showing change over time, we’re showing progress against a target
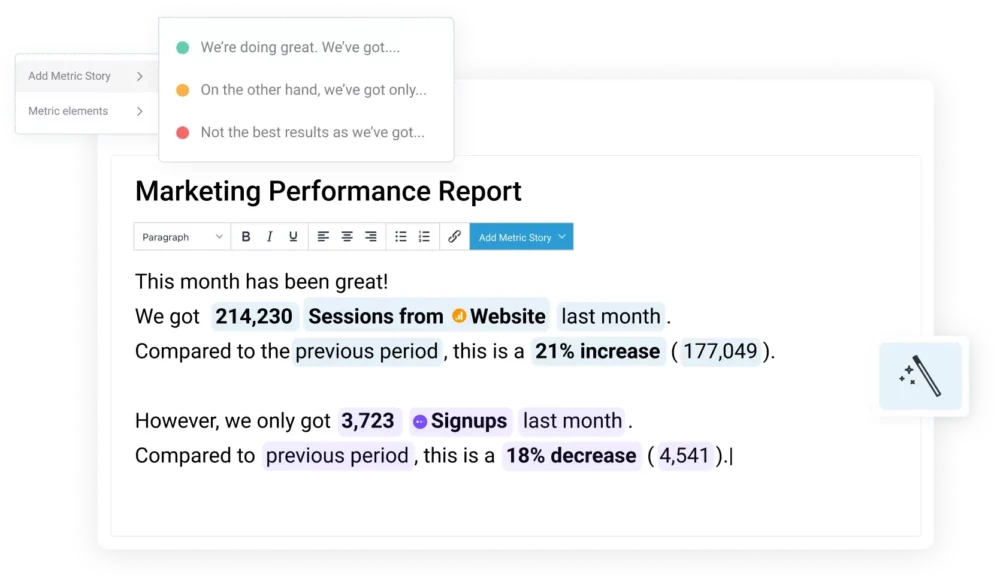
- Text blocks let us provide context around goals, strategy, or campaigns directly in the dashboard and AI summaries help draft immediate context

This has made it easier for us to partner with our clients to tell a performance story that resonates with their stakeholders — especially when we’re reporting to executive leadership.
What We and Our Clients Appreciate Most
Different people use Databox differently at Weidert, and that’s a good thing.
- Our paid media manager, Charles, uses it to build out ad dashboards across platforms
- Chelsea, our Director of Client Strategy, experimented with dashboards segmented by content goals: Brand Awareness, Lead Gen, and Thought Leadership
- Several clients have tried using HubSpot dashboards, but ultimately prefer Databox because it gives them better visibility across GA4 and other tools
We also embed Databox datawalls into HubSpot dashboards, making it easier to connect marketing and sales data for closed-loop reporting without leaving the CRM. Clients love being able to pull up their dashboard at any time without having to wait for a monthly report.
How Data Stories Automate Our Client Reporting
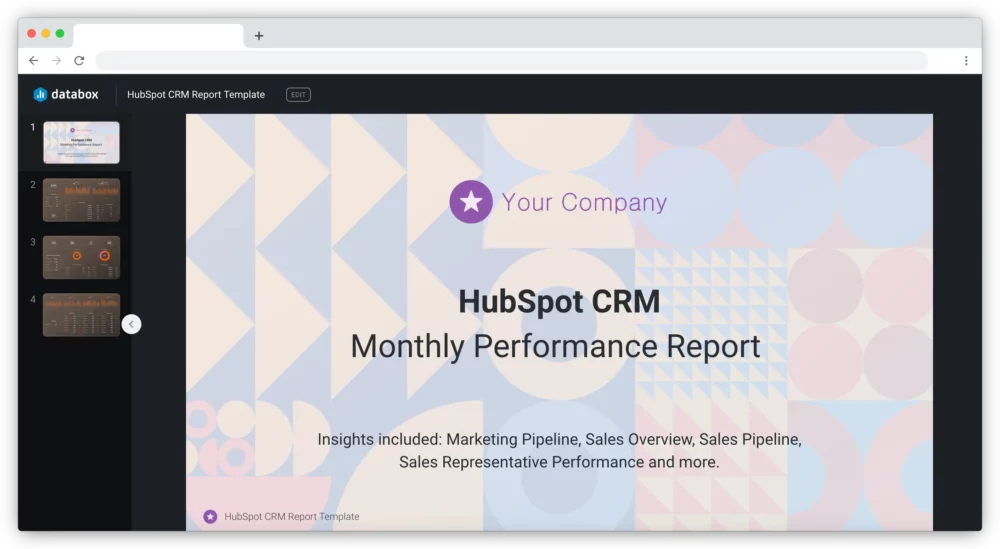
Let’s be honest: creating slide decks for marketing and sales performance reviews is never anyone’s favorite task. With Databox’s Reports and Data Stories features, we’ve streamlined that whole process.
Now, we can:
- Pull in the latest data with no manual formatting
- Add narrative insights and context
- Share reports as live links or scheduled emails

There are two primary layout options:
- Slides, which we use for live meetings
- Pageless, which is great for async reviews
Other features we love:
- Presenter-only notes
- Report archives for historical comparisons
- Pre-built templates
- Customizable background images and layout flexibility
When We Use Dashboards vs. Reports
We’ve developed a rhythm for when to use what:
| Use Case | Tool |
| Weekly performance check-ins | Live dashboards |
| Monthly and quarterly reviews | Reports with Data Stories |
| Roadmap planning and alignment | Report templates with summaries |
| Defining or explaining metrics | Text blocks in Reports |
| Connecting sales and marketing | Embedded HubSpot + Databox data |

The Results: Better Insights, Less Time, Stronger Relationships
We implemented Databox years ago to make metrics tracking and reporting more efficient. With these newer features, what we’ve gained is not just efficiency, but a better way to tell stories with our data.
The tools have reduced the time we spend ingesting information and drawing insights from it. Instead of compiling reports, we spend more time acting on what the data tells us. That shift has made our internal discussions sharper, our client conversations more strategic, and our plans more focused.
With features like Data Stories and automated reports, we’re not just communicating performance — we’re helping clients understand the “why” behind the numbers and the “what now” for next steps. That’s the real value: turning reporting into action.
Want to simplify how you report to clients? Explore Databox’s dashboard and reporting tools for agencies.


