Table of contents
You know the feeling. It’s Monday morning, and someone asks, “How are we doing?” Suddenly, you’re toggling between six tabs, exporting CSVs, and trying to remember which dashboard has the number they actually need.
By the time you’ve pulled everything together, the meeting’s over.
This was the problem we originally built Databox to solve: centralizing scattered data into dashboards that actually make sense. But dashboards were only the first step. The real question was never “can I see my data?” It was “Can I understand it fast enough to act?”
That’s where AI analytics changes everything.
The Problem with Traditional Analytics
Most businesses sit in an awkward position when it comes to AI and data.
Dashboards show you what happened. They don’t tell you what it means. You can stare at a chart showing traffic dropped 15%, but the dashboard won’t explain why, won’t tell you if it matters, and won’t suggest what to do next. That interpretation still requires a human, usually one who’s busy with three other requests.
Enterprise AI tools require enterprise infrastructure. The sophisticated analytics platforms assume you have a data warehouse, a semantic layer, and data engineers maintaining pipelines. For most growing businesses, that’s months of setup before you get any value.
Data is scattered across dozens of tools. Marketing lives in HubSpot. Revenue is in Stripe. Advertising splits across Google, Meta, and LinkedIn. Finance sits in QuickBooks. AI needs access to all of it, and building those connections traditionally meant custom development for each source.
Most “AI analytics” is just a chatbot bolted onto a dashboard. You can ask questions, but the AI is trapped inside one vendor’s ecosystem. When a better model launches next month, you can’t use it. You’re locked into whatever AI your BI vendor chose to embed.
The result: businesses that could benefit most from AI analytics often can’t access it without significant investment in infrastructure they don’t have time to build.
How Databox Approaches AI Analytics
We took a different path.
We built AI capabilities directly into Databox—and we also built Databox to work as the data layer that connects to any external AI. You get both: native intelligence inside the platform, and the flexibility to bring your own.
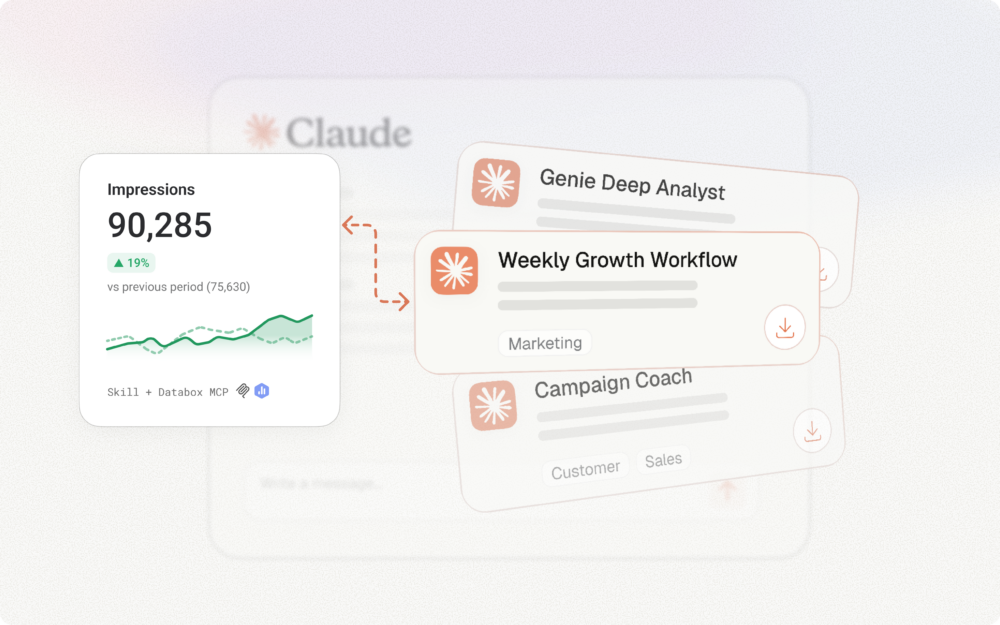
Databox MCP exposes your connected data, 100+ integrations worth, through the Model Context Protocol. This means Claude, ChatGPT, or any MCP-compatible AI can query your business metrics directly. When a better model launches, you’ll be able to use it immediately.
Genie, our AI assistant, lives inside Databox for teams who want answers without leaving the platform. Ask “Why did conversion drop last week?” and Genie analyzes the data, identifies patterns, and explains what’s happening in plain language. It’s conversational analytics that actually understands your business context.
The combination matters: Genie for quick answers inside the product, MCP for connecting your data to the broader AI ecosystem. You’re not choosing between convenience and flexibility. You get both.
AI-Powered Features
Beyond Genie and MCP, we’ve built AI capabilities throughout the platform:
Performance Summaries generate written overviews of your key metrics. Instead of scanning charts, you get a concise explanation: what’s up, what’s down, what needs attention.
Metric Forecasts predict where your numbers are heading. Traffic, revenue, signups—see projected trends based on historical patterns. Set goals grounded in data rather than gut feel.
Anomaly Detection monitors key metrics continuously and alerts you when something significant changes. Ad costs spike, conversions drop, leads dry up—you know within hours, not days.
These features share a philosophy: analytics should tell you what’s happening and what to do about it. Display numbers and leave interpretation to you? That’s the old model.
Who This Is For
If you’ve ever thought “we have the data, we just can’t make sense of it fast enough”—that’s exactly the problem we solve.
Teams running marketing across multiple channels. Agencies managing performance for clients who want answers yesterday. SaaS companies scaling past the point where spreadsheets work, but before they can justify a data team. E-commerce businesses where a day of bad ad performance means real money lost.
The common thread: organizations that need serious analytics capabilities but can’t afford—in time or money—the traditional path to get there.
Getting Started
The fastest path to AI analytics with Databox:
1. Connect your data sources. Start with where your most important metrics live—typically a CRM, advertising platforms, and website analytics. Most integrations take one click.
2. Use Genie to get set up faster. Inside Databox, Genie can analyze trends, explain changes, and surface insights without you needing to build a single report. Ask questions and get answers immediately.
3. Enable proactive monitoring. Turn on anomaly detection for metrics where early warning matters. Let the system watch your data so you don’t have to.
4. Set up Databox MCP. Add the MCP server to Claude Desktop or your preferred AI client. Your performance data—including Genie insights, anomalies, and goals—becomes accessible to your entire AI ecosystem. Ask questions and automate work across any MCP-compatible tool.
The setup takes minutes. The impact, getting real answers from your data instead of just charts, starts immediately.
The Bottom Line
AI analytics is about removing the friction between having data and making decisions.
With Databox MCP, your data talks to any AI. With Genie, you get instant analysis inside the platform. With forecasts, anomaly detection, and benchmarks, the system actively helps you improve performance—and track it.
The gap between “we have the data” and “we made the right call” just got a lot smaller.
Ready to start? Connect your data sources, add the MCP server to Claude, and ask your first question. Get started with Databox →