

Already have an account? Sign in
Sign up for free
Connect your datasources and instantly see your data in this template.
Creating your account...
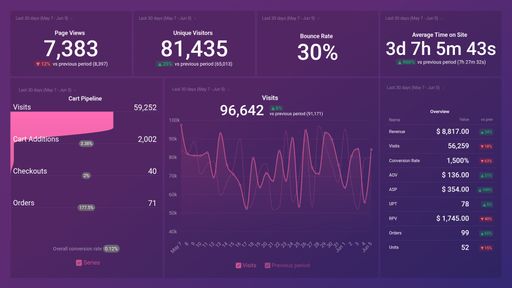
An adobe Analytics Dashboard is a powerful tool for businesses looking to understand how their website or mobile app is performing. It allows you to track all your most important metrics and KPIs providing you with a real-time snapshot of your websites or mobile apps success. Data visualized within the Adobe Analytics dashboard can help you make fast and informed decisions at any moment.
An Adobe Analytics dashboard should include all of your most important metrics and KPIs. You need to access how your website or app is doing at a glance so metrics like Average Order Value, Bounce Rate, Time on site can help provide you with deeper insights allowing you to make more informed strategic decisions.


Drag & drop your metrics
No-code editor
Fully customizable
Trusted by 20,000+ growing businesses


Explore all the different ways you can use Databox to gain better data insights needed to drive better business decisions. Discover our pre-built templates from various integrations that businesses use on a daily basis to improve performance.
Whether you are looking for client reporting dashboards, agency dashboards, marketing dashboards, or sales dashboards, Databox can help you build them.
Let us know what you are trying to build and our team of experts will help you turn your data into actionable insights.
Book a callCompare
Databox Inc.
HQ: Boston, MA, USA
AI-powered analytics for teams that need answers now.
Databox Inc.
HQ: Boston, MA, USA

AI-powered analytics for teams that need answers now.


Compare
Connect your datasources and instantly see your data in this template.
Creating your account...