


![How to Write a Business Analysis Report [Examples and Templates]](https://cdnwebsite.databox.com/wp-content/uploads/2022/01/17062824/business-analysis-report.jpg "How to Write a Business Analysis Report [Examples and Templates]")
Table of contents
Business analysis reports are a lot like preparing a delicious meal.
Sometimes, the recipe is simple enough that you only need to use the basic ingredients. Other times, you will have to follow specific instructions to ensure those tasty delicacies turn out just right.
Want to make sure your business report never turns out like a chewy piece of meat? You’ve come to the right place.
Stay tuned until the end of this blog post, and we promise you won’t be hungry… for business knowledge!
- What Is a Business Analysis Report?
- Why Is Analytical Reporting Important?
- What Should Be Included in a Business Analysis Report?
- How Do You Write a Business Analysis Report?
- Business Data Analysis Report Examples and Templates
- Improve Business Reporting with Databox

What Is a Business Analysis Report?
A business analysis report provides information about the current situation of your company. This report is usually created by the management to help in the decision-making process and is usually used by other departments within a company.
Business analysis reports can either focus your research on the effectiveness of an existing business process or a proposed new process. Besides, an effective business analysis report should also assess the results to determine if the process changes had a positive or negative effect on the company’s goals. In fact, according to Databox’s State of business reporting, an overwhelming majority of companies said that reporting improved their performance.
Why Is Analytical Reporting Important?
Analytical reports are the bridge that connects your company to an effective, data-driven business intelligence strategy. By leveraging analytical reports, you can make informed decisions about your organization’s most critical issues. You will no longer need to rely on gut instinct or anecdotal evidence when assessing risks, threats, and opportunities. Instead, you will have access to a wealth of reliable data to inform your decisions.
Here are some essential benefits of analytical reporting:
- Improve communication and foster collaboration – The most obvious benefit of business analysis report writing is an improvement in communication between all stakeholders involved in the project. Also, analytical business reports can help you to generate more trust and foster better collaboration among your employees and colleagues. By using data analytics reporting tools, you will be able to monitor your employees’ performance on a day-to-day basis. This will allow you to hold them accountable for their actions and give them greater freedom within the business as they know that their superiors have faith in their decision-making capabilities.
- Increase productivity – Without this level of shared insight, businesses struggle to stay on top of their most important tasks and can become less efficient. An effective analytical business report provides the information needed for more efficient internal processes and helps you find more time for strategic activities such as improving your business strategy or working on long-term goals.
- Innovation – In today’s digital age, the pressure to innovate was never greater. When consumers basically have everything they want at their fingertips, stepping up to the plate with a new and improved product or service has never been more important. With an accessible dashboard in place, you will be able to create data-driven narratives for each of your business’ critical functions. For example, if you are a software company, you can use the insights gained from report analysis done with your dashboard software to tailor your product development efforts to the actual needs of your customers. By doing so, you will be able to develop products that are better tailored to specific customer groups. You can also use the same information for developing new marketing strategies and campaigns.
- Continuous business evolution – When it comes to digital businesses, data is everything. No model lasts forever, so having access to a business dashboard software that allows you to constantly keep tabs on your business’ performance will help you refine it as time goes on. If there are any glitches in your business model, or if something isn’t panning out as expected, the insight offered by a business analysis report can help you improve upon what works while scrapping what doesn’t.
What Should Be Included in a Business Analysis Report?
A business analysis report has several components that need to be included to give a thorough description of the topic at hand. The structure and length of business analysis reports can vary depending on the needs of the project or task.
They can be broken down into different sections that include an:
- Executive summary
- Study introduction
- Methodology
- Review of statistics
- Conclusion
- References
Reports of this nature may also include case studies or examples in their discussion section.
A report can be written in a formal or informal tone, depending on the audience and purpose of the document. While a formal tone is best for executives, an informal tone is more appropriate for technical audiences. It is also a good idea to use something like an executive summary template to report on the results repeatedly with ease.
Build automated reports and make better decisions
Report what happened, what changed, then talk about what to do next.
How Do You Write a Business Analysis Report?
A good business analysis report is detailed and provides recommendations in the form of actionable steps. Here we have listed some simple steps that you need to follow to write a good business analysis report. Report writing is a major part of the business analysis process. In this section, you will learn how to write a report for your company:
Preparation
Obtain an overview of what you want to analyze in the business report. For example, if you are writing a business analysis report on how to improve customer service at an insurance company, you will want to look through all the customer service processes to determine where the problems lie. The more prepared you are when starting a project, the easier it will be to get results. Here is what your preparation should look like:
Set your goals
The first step in writing this document is to set your goals. What do you hope to accomplish with this paper? Do you need to assess the company’s finances? Are you looking for ways to make improvements? Or do you have outside investors who want to know if they should buy into the company? Once you know what your goal is, then you can begin setting up your project.
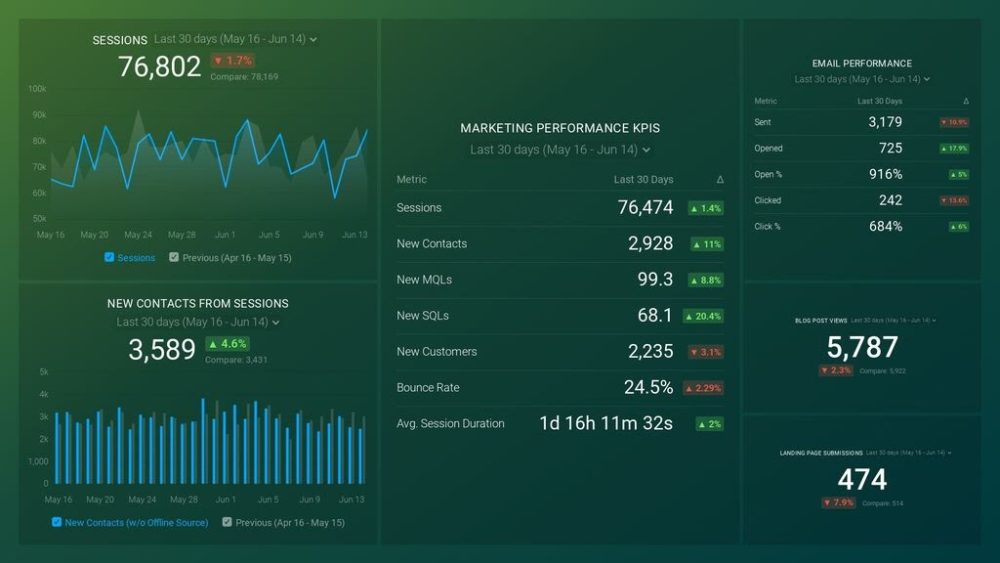
PRO TIP: How Well Are Your Marketing KPIs Performing?
Like most marketers and marketing managers, you want to know how well your efforts are translating into results each month. How much traffic and new contact conversions do you get? How many new contacts do you get from organic sessions? How are your email campaigns performing? How well are your landing pages converting? You might have to scramble to put all of this together in a single report, but now you can have it all at your fingertips in a single Databox dashboard.
Our Marketing Overview Dashboard includes data from Google Analytics 4 and HubSpot Marketing with key performance metrics like:
- Sessions. The number of sessions can tell you how many times people are returning to your website. Obviously, the higher the better.
- New Contacts from Sessions. How well is your campaign driving new contacts and customers?
- Marketing Performance KPIs. Tracking the number of MQLs, SQLs, New Contacts and similar will help you identify how your marketing efforts contribute to sales.
- Email Performance. Measure the success of your email campaigns from HubSpot. Keep an eye on your most important email marketing metrics such as number of sent emails, number of opened emails, open rate, email click-through rate, and more.
- Blog Posts and Landing Pages. How many people have viewed your blog recently? How well are your landing pages performing?
Now you can benefit from the experience of our Google Analytics and HubSpot Marketing experts through a plug-and-play Databox template. It includes key metrics for tracking your leads and can be used as a standalone dashboard or as part of your marketing reports. You can try it during your free trial no setup headaches.
You can easily set it up in just a few clicks – no coding required.
To set up the dashboard, follow these 3 simple steps:
Step 1: Get the template
Step 2: Connect your HubSpot and Google Analytics 4 accounts with Databox.
Step 3: Watch your dashboard populate in seconds.
Assess the Company’s Mission
It’s almost impossible to write a business analysis report without access to the company’s mission statement. Even if you don’t plan on using the mission statement as part of your business analysis summary, it can help you understand the company’s culture and goals. Mission statements are typically short and easy to read, but they may not include every area of focus that you want to include in your report.
Thus, it is important to use other sources when possible. For example, if you are writing a business analysis report for a small start-up company that is just beginning to market its product or service, review the company website or talk directly with management to learn what they believe will be most crucial in growing the company from the ground up.
Stakeholder Analysis
Who is your audience? Create the reader’s persona and tailor all information to their perspective. Create a stakeholder map that identifies all the groups, departments, functions, and individuals involved in this project (and any other projects related to this one). Your stakeholder map should include a description of each group’s role.
Review Financial Performance
Review the financing of the business and determine whether there are any potential threats to the company’s ability to meet its future financial obligations. This includes reviewing debt payments and ownership equity compared with other types of financing such as accounts receivable, cash reserves, and working capital. Determine whether there have been any changes in the funding over time, such as an increase in long-term debt or a decrease in owners’ equity.
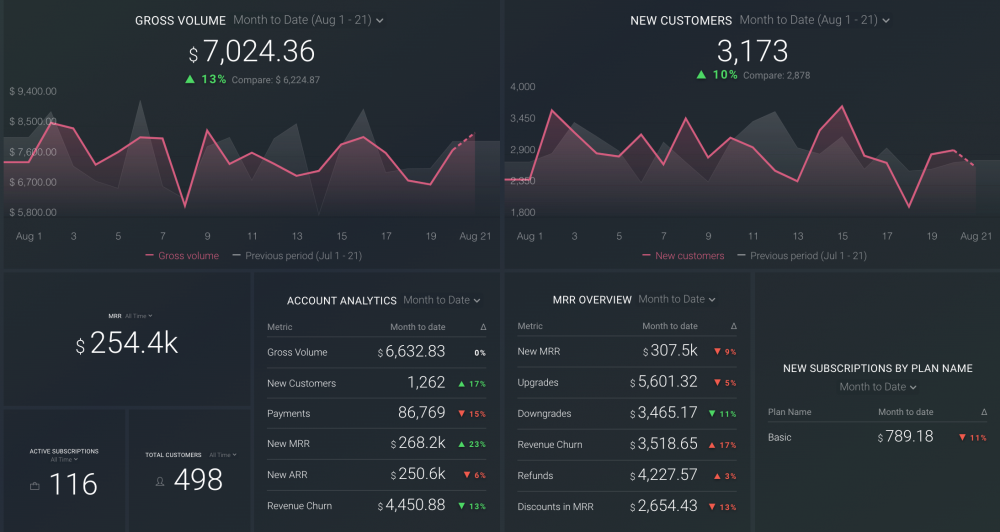
Apart from reviewing your debt payments and ownership equity with other types of financing, wouldn’t it be great if you could compare your financial performance to companies that are exactly like yours? With Databox, this can be done in less than 3 minutes.
For example, by joining this benchmark group, you can better understand your gross profit margin performance and see how metrics like income, gross profit, net income, net operating increase, etc compare against businesses like yours.
One piece of data that you would be able to discover is the average gross profit a month for B2B, B2C, SaaS and eCommerce. Knowing that you perform better than the median may help you evaluate your current business strategy and identify the neccessary steps towards improving it.
Interpreting results in a business analysis report often requires more than summarizing numbers. Teams need to understand what changed, what influenced those changes, and how current performance compares to past periods. With AI tools like Databox MCP, it’s now possible to ask specific questions about business performance and receive answers grounded in actual metrics and historical data. Because it uses your definitions and prior results, the explanations are consistent with how your organization measures success, helping strengthen the reasoning behind the conclusions included in the report.
Instantly and Anonymously Benchmark Your Company’s Performance Against Others Just Like You
If you ever asked yourself:
- How does our marketing stack up against our competitors?
- Are our salespeople as productive as reps from similar companies?
- Are our profit margins as high as our peers?
Databox Benchmark Groups can finally help you answer these questions and discover how your company measures up against similar companies based on your KPIs.
When you join Benchmark Groups, you will:
- Get instant, up-to-date data on how your company stacks up against similar companies based on the metrics most important to you. Explore benchmarks for dozens of metrics, built on anonymized data from thousands of companies and get a full 360° view of your company’s KPIs across sales, marketing, finance, and more.
- Understand where your business excels and where you may be falling behind so you can shift to what will make the biggest impact. Leverage industry insights to set more effective, competitive business strategies. Explore where exactly you have room for growth within your business based on objective market data.
- Keep your clients happy by using data to back up your expertise. Show your clients where you’re helping them overperform against similar companies. Use the data to show prospects where they really are… and the potential of where they could be.
- Get a valuable asset for improving yearly and quarterly planning. Get valuable insights into areas that need more work. Gain more context for strategic planning.
The best part?
- Benchmark Groups are free to access.
- The data is 100% anonymized. No other company will be able to see your performance, and you won’t be able to see the performance of individual companies either.
When it comes to showing you how your performance compares to others, here is what it might look like for the metric Average Session Duration:

And here is an example of an open group you could join:

And this is just a fraction of what you’ll get. With Databox Benchmarks, you will need only one spot to see how all of your teams stack up — marketing, sales, customer service, product development, finance, and more.
- Choose criteria so that the Benchmark is calculated using only companies like yours
- Narrow the benchmark sample using criteria that describe your company
- Display benchmarks right on your Databox dashboards
Sounds like something you want to try out? Join a Databox Benchmark Group today!
Examine the “Four P’s”
“Four P’s” — product, price, place, and promotion. Here’s how they work:
- Product — What is the product? How does it compare with those of competitors? Is it in a position to gain market share?
- Price — What is the price of the product? Is it what customers perceive as a good value?
- Place — Where will the product be sold? Will existing distribution channels suffice or should new channels be considered?
- Promotion — Are there marketing communications efforts already in place or needed to support the product launch or existing products?
Evaluate the Company Structure
A business analysis report examines the structure of a company, including its management, staff, departments, divisions, and supply chain. It also evaluates how well-managed the company is and how efficient its supply chain is. In order to develop a strong strategy, you need to be able to analyze your business structure.
Structure
When writing a business analysis report, it’s important to make sure you structure your work properly. You want to impress your readers with a clear and logical layout, so they will be able to see the strengths of your recommendations for improving certain areas of the business. A badly written report can completely ruin an impression, so follow these steps to ensure you get it right the first time.
Formatting
A typical business analysis report is formatted as a cover page, an executive summary, information sections, and a summary.
- A cover page contains the title and author of the report, the date, a contact person, and reference numbers.
- The information section is backed up by data from the work you’ve done to support your findings, including charts and tables. Also, includes all the information that will help you make decisions about your project. Experience has shown that the use of reputable study materials, such as StuDocu and others, might serve you as a great assistant in your findings and project tasks.
- A summary is a short overview of the main points that you’ve made in the report. It should be written so someone who hasn’t read your entire document can understand exactly what you’re saying. Use it to highlight your main recommendations for how to change your project or organization in order to achieve its goals.
- The last section of a business analysis report is a short list of references that include any websites or documents that you used in your research. Be sure to note if you created or modified any of these documents — it’s important to give credit where credit is due.
The Process of Investigation
Explain the problem – Clearly identify the issue and determine who is affected by it. You should include a detailed description of the problem you are analyzing, as well as an in-depth analysis of its components and effects. If you’re analyzing a small issue on a local scale, make sure that your report reflects this scale. That way, if someone else reads your work who had no idea about its context or scope, they would still be able to understand it.
Explain research methods – There are two ways to do this. Firstly, you can list the methods you’ve used in the report to determine your actions’ success and failure. Secondly, you should add one or two new methods to try instead. Always tell readers how you came up with your answer or what data you used for your report. If you simply tell them that the company needs to improve customer service training then they won’t know what kind of data led you to that conclusion. Also, if there were several ways of addressing a problem, discuss each one and why it might not work or why it may not be appropriate for the company at this time.
Analyze data – Analyzing data is an integral part of any business decision, whether it’s related to the costs of manufacturing a product or predicting consumer behavior. Business analysis reports typically focus on one aspect of an organization and break down that aspect into several parts — all of which must be analyzed in order to come to a conclusion about the original topic.
The Outcome of Each Investigation Stage
The recommendations and actions will usually follow from the business objectives not being met. For example, if one of your goals was to decrease costs then your recommendations would include optimization strategies for cost reduction. If you have more than one suggestion you should make a list of the pros and cons of each one. You can make several recommendations in one report if they are related. In addition, make sure that every recommendation has supporting arguments to back them up.
Report Summary
Every business analysis report should start with a summary. It’s the first thing people see and it needs to capture their attention and interest. The report summary can be created in two ways, depending on the nature of the report:
- If the report is a brief one, that simply gives a summary of the findings, then it can be created as part of the executive summary.
- But if it’s a long report, it could be too wordy to summarise. In this case, you can create a more detailed overview that covers all the main aspects of the project from both an internal and external point of view.
Presentation
Everything comes down to this section. A presentation is designed to inform, persuade and influence decision-makers to take the next action steps.
Sometimes a slide or two can make them change their mind or open new horizons. These days, digital dashboards are becoming increasingly popular when it comes to presenting data in business reports. Dashboards combine different visualizations into one place, allowing users to get an overview of the information they need at a glance rather than searching through a bunch of documents or spreadsheets trying.
Databox offers dynamic and accessible digital dashboards that will help you to convert raw data into a meaningful story. And the best part is that you can do it with a ‘blink of an eye’ even if you don’t have any coding or designs skills. There is also an option of individual report customization so that you can tailor any dashboard to your own needs.
Business Data Analysis Report Examples and Templates
Pre-made dashboard templates can be extremely useful when creating your own business analysis report. While examples serve as inspiration, templates allow you to create reports quickly and easily without having to spend time (and money) developing the underlying data models.
Databox dashboard templates come with some of the most common pre-built metrics and KPIs different types of businesses track across different departments. In order to create powerful business insights within minutes, all you need to do is try our premade templates and connect your data source — the metrics will populate automatically.
Business Report Examples and Templates
Databox business dashboard examples are simple and powerful tools for tracking your business KPIs and performance. These dashboards can be used by executive teams and managers as well as by senior management, marketing, sales, customer support, IT, accounting, and other departments. If you are new to this kind of reporting, you may not know how to set up a dashboard or what metrics should be displayed on it. This is where a premade template for business dashboards comes in handy.
For example, this Google Ads Report Template is designed to give you a simple way to keep track of your campaigns’ performance over time, and it’s a great resource for anyone who uses Google’s advertising platform, regardless of whether they’re an SMB, an SME or an enterprise.
KPI Report Examples and Templates
KPIs are the foundation of any business analysis, and they can come in a multitude of forms. While we’ve defined KPIs as metrics or measurements that allow you to assess the effectiveness of a given process, department, or team, there are a number of ways to evaluate your KPIs. Through the use of color-coding, user-friendly graphs and charts, and an intuitive layout, your KPIs should be easy for anyone to understand. A good way to do this is by having a dedicated business analyst on your team who can take on the task of gathering data, analyzing it, and presenting it in a way that will drive actionable insights. However, if you don’t have a dedicated analyst or don’t want to spend money on one, you can still create KPI reporting dashboards using KPI Databox templates and examples.
For example, this Sales Overview template is a great resource for managers who want to get an overview of their sales team’s performance and KPIs. It’s perfect for getting started with business analysis, as it is relatively easy to understand and put together.
Performance Report Examples and Templates
All businesses, regardless of size or industry, need to know how well they are performing in order to make the best decisions for their company and improve overall ROI. A performance dashboard is a strategic tool used to track key metrics across different departments and provide insight into the health of a business. Databox has a collection of 50+ Performance Dashboard Examples and Templates which are available for download.
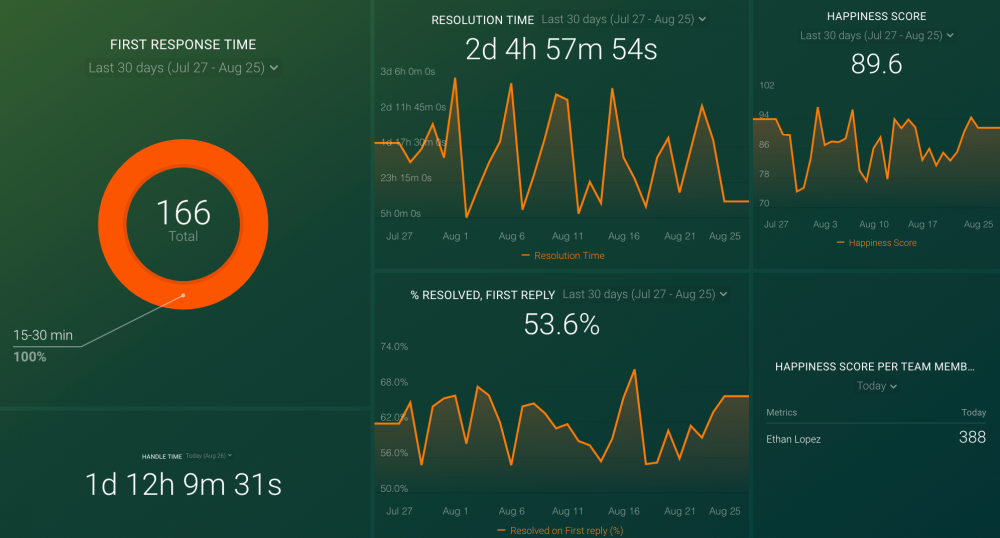
For example, if your business is investing a lot into customer support, we recommend tracking your customer service performance with this Helpscout Mailbox Dashboard which will give you insights into conversations, your team’s productivity, customer happiness score, and more.
Executive Report Examples and Templates
An executive dashboard is a visual representation of the current state of a business. The main purpose of an executive dashboard is to enable business leaders to quickly identify opportunities, identify areas for improvement, pinpoint issues, and make data-informed decisions for driving sales growth, new product launches, and overall business growth. When an executive dashboard is fully developed, as one of these 50+ Databox Executive Examples and Templates, it offers a single view of the most important metrics for a business at a glance.
For example, you probably have more than one set of financial data tracked using an executive dashboard software: invoices, revenue reports (for accounting), income statements, to mention a few. If you want to view all this data in one convenient place, or even create a custom report that gives you a better picture of your business’s financial health, this Stripe Dashboard Template is a perfect solution for you.
Metrics Report Examples and Templates
Choosing the right metrics for your business dashboard can be crucial to helping you meet your business objectives, evaluate your performance, and get insights into how your business is operating. Metrics dashboards are used by senior management to measure the performance of their company on a day-to-day basis. They are also used by mid-level managers to determine how their teams are performing against individual goals and objectives. Databox provides 50+ Metrics Dashboard Examples and Templates that you can use to create your company’s own dashboards. Each is unique and will depend on your business needs.
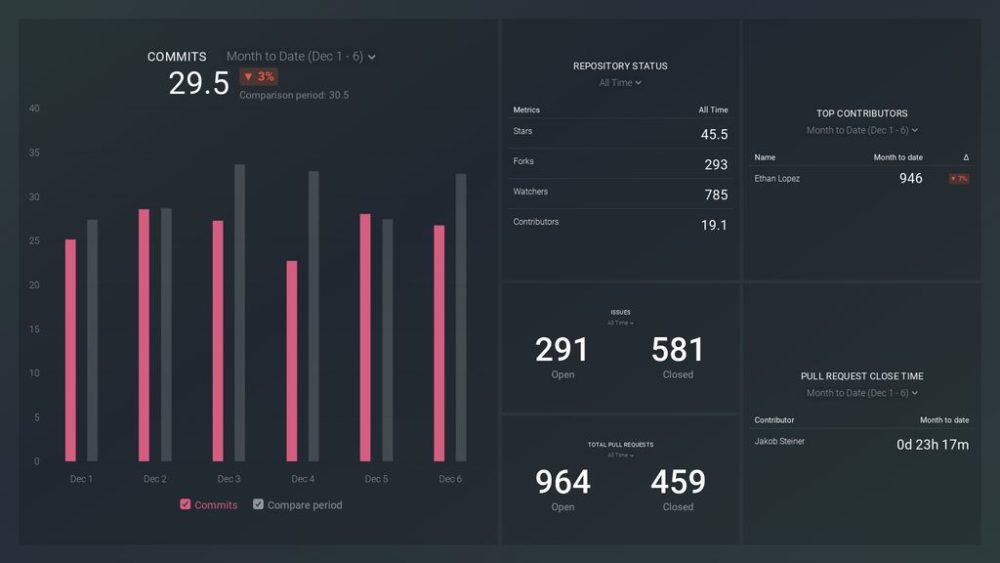
For example, if you are looking for ways to track the performance of your DevOps team, and get the latest updates on projects quickly – from commits, and repository status, to top contributors to your software development projects, this GitHub Overview Dashboard is for you.
Small Business Report Examples and Templates
A lot of small business owners don’t realize how important it is to have a proper dashboard in place until they actually use one. A dashboard can help you track and compare different metrics, benchmark your performance against industry averages, evaluate the effectiveness of your marketing and sales strategies, track financials, and much more. So if you’re looking for a tool to help you measure and manage your small business’ performance, try some of these 50+ Small Business Dashboard Examples and Templates.
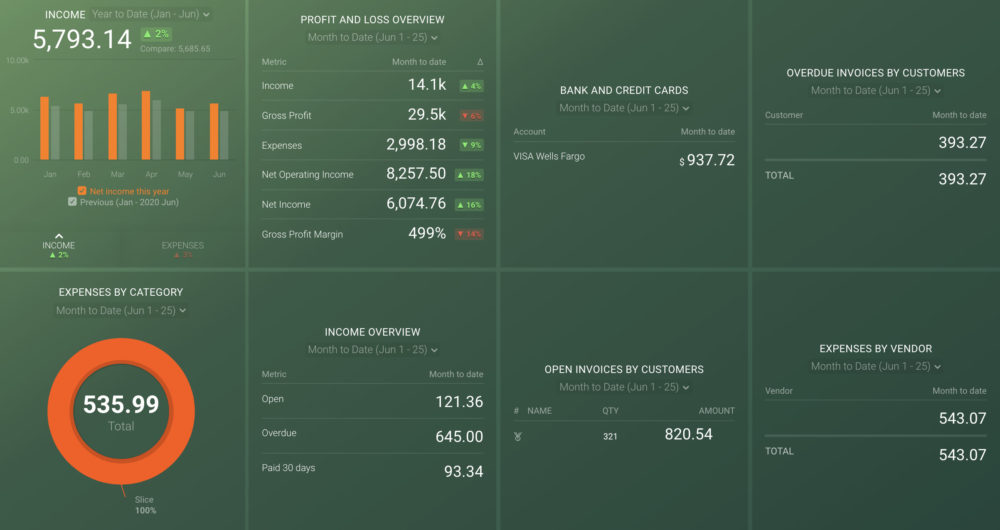
For example, this Quickbooks Dashboard template can help you get a clear understanding of your business’s financial performance, ultimately allowing you to make better-informed decisions that will drive growth and profitability.
Agency Report Examples and Templates
Agency dashboards are not a new concept. They have been around for years and are used by companies all over the world. Agency dashboards can be powerful tools for improving your marketing performance, increasing client loyalty, and landing new clients. There is no single correct way to create an agency dashboard. Everyone has their own goals and objectives, which will ultimately determine which data points you choose to include or track using a client dashboard software, but with these Databox 100+ Agency Dashboard Examples and Templates you have plenty of options to start with.
For example, you can use this Harvest Clients Time Report to easily see how much time your employees spend working on projects for a particular client, including billable hours and billable amount split by projects.

Better Business Reporting with Databox
Business analysis is all about finding smart ways to evaluate your organization’s performance and future potential. And that’s where Databox comes in.
Databox can be a helpful tool for business leaders who are required to analyze data, hold frequent meetings, and generate change in their organizations. From improving the quality and accessibility of your reporting to tracking critical performance metrics in one place, and sharing performance metrics with your peers and team members in a cohesive, presentable way, allow Databox to be your personal assistant in these processes, minimize the burdens of reporting and ensure you always stay on top of your metrics game.
Sign up today for a free trial to start streamlining your business reporting process.
FAQ
Databox is a Business Intelligence (BI) platform known for its simplicity, analytics, and shareable dashboards. It helps professionals write better business analysis reports by consolidating data from tools like HubSpot, Google Analytics, and QuickBooks into one centralized, visual dashboard.
With pre-built templates, benchmarking tools, and KPI tracking, Databox streamlines the reporting process. It allows you to identify trends, contextualize performance, and present insights clearly—making your business analysis reports faster to create and more effective at driving decisions.
Databox provides customizable dashboards that allow you to consolidate and track all key performance indicators (KPIs) from multiple sources. With its easy-to-use templates, you can create visual reports that highlight critical metrics, making business analysis reports more effective. This ensures that your data is not only accessible but also actionable, supporting better decision-making.
Yes! Databox integrates with financial platforms like QuickBooks to track essential financial KPIs such as gross profit, net income, revenue, and expenses. With Databox’s financial reporting templates, you can seamlessly monitor the health of your business and include accurate financial insights in your business analysis report.
Databox offers pre-built templates like the Marketing Overview Dashboard to help track marketing performance metrics such as sessions, conversion rates, lead generation, and ROI. By incorporating these visualizations in your business analysis report, you can demonstrate the effectiveness of your marketing strategies and propose improvements.
Databox enables you to create dynamic and dashboards that automatically update as new data comes in. You can build customized reports for specific departments (e.g., marketing, finance, or customer service) and use the insights from these dashboards to guide your business analysis. With Databox, reporting becomes a continuous, data-driven process instead of a one-time task.
Absolutely! Databox allows you to share customized dashboards with your team, enabling collaborative decision-making. Whether you need to share financial insights with the finance team or marketing data with the marketing team, you can easily send interactive reports that all stakeholders can access in .


