 Harvest (1)
Already have an account? Sign in
Sign up for free
Connect your datasources and instantly see your data in this template.
Creating your account...
These employee time tracking dashboards come pre-built with some of the most commonly tracked project management KPIs and metrics from the most popular tools. You can also customize your templates later. To get started, just choose a template, connect your data, and your metric visualizations will populate automatically.
Try It Free
No design or coding skills necessary.
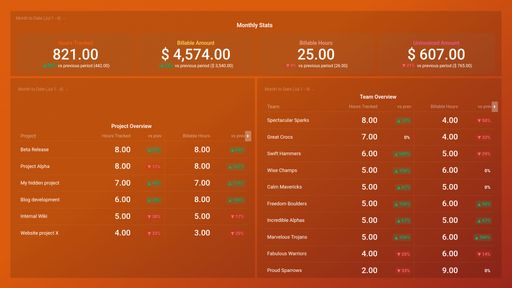
Learn more about Dashboard DesignerAn employee time tracking dashboard provides you with a granular view of employee work hours, ongoing and completed tasks, projects, and expenses.
This dashboard offers a visual display of what individual team members are working on, the length of time they spend by project, client, tasks, and team, and the amount due for the time and effort put in.
When building an employee time tracking dashboard, it is important to include the right project management metrics and KPIs. This will in turn, allow you to quickly identify productivity and performance bottlenecks, and help employees take better ownership of their work and schedule.
Also, by tracking the right employee time tracking metrics, you’ll be able to see the status of projects, prioritize tasks better, improve operational efficiency, and generate more accurate quotes and estimates.
The most important employee tracking metrics you should be tracking are:


Connect your datasources and instantly see your data in this template.
Creating your account...