


Table of contents
Keeping an eye on your finances is critical if you want to run a successful business. No wonder finance is one of the most monitored and reported operations, according to Databox’s State of Business Reporting.
However, many entrepreneurs try to reinvent the wheel and overcomplicate this process with custom financial reports.
Instead, you can get all of the data and insights you need in less time if you use report templates.
In this post, we’re sharing a handful of finance report templates you can recreate in any financial reporting software.

1. Income Statement
An income statement shows the company’s revenue breakdown as well as expenses and debts.
Susan Melony of Unbreak Yourself explains, “An income statement is always a useful report. As we always know, profit is the aim of every business. Thus, I consider the income statement as the financial report that can directly help in evaluating the business and forming strategies for its betterment.
Through this report, the management can assess the balance or ratio of expenses and income of a certain period. This information can help figure out the profitability of the businesses and its efficiency when it comes to incurring expenses, leading to the assessment of the strategy used, and deciding whether it is effective or not. All in all, an income statement is not just a report used in computing the revenues but it is also a strong basis of forecast and strategies.”
Tomek Mlodzki of PhotoAiD says, “It can cover a broad range of time (annually, quarterly) and can be also compared with the same report of the previous years. You can monitor the growth of your company and the months in which you need a different approach.”
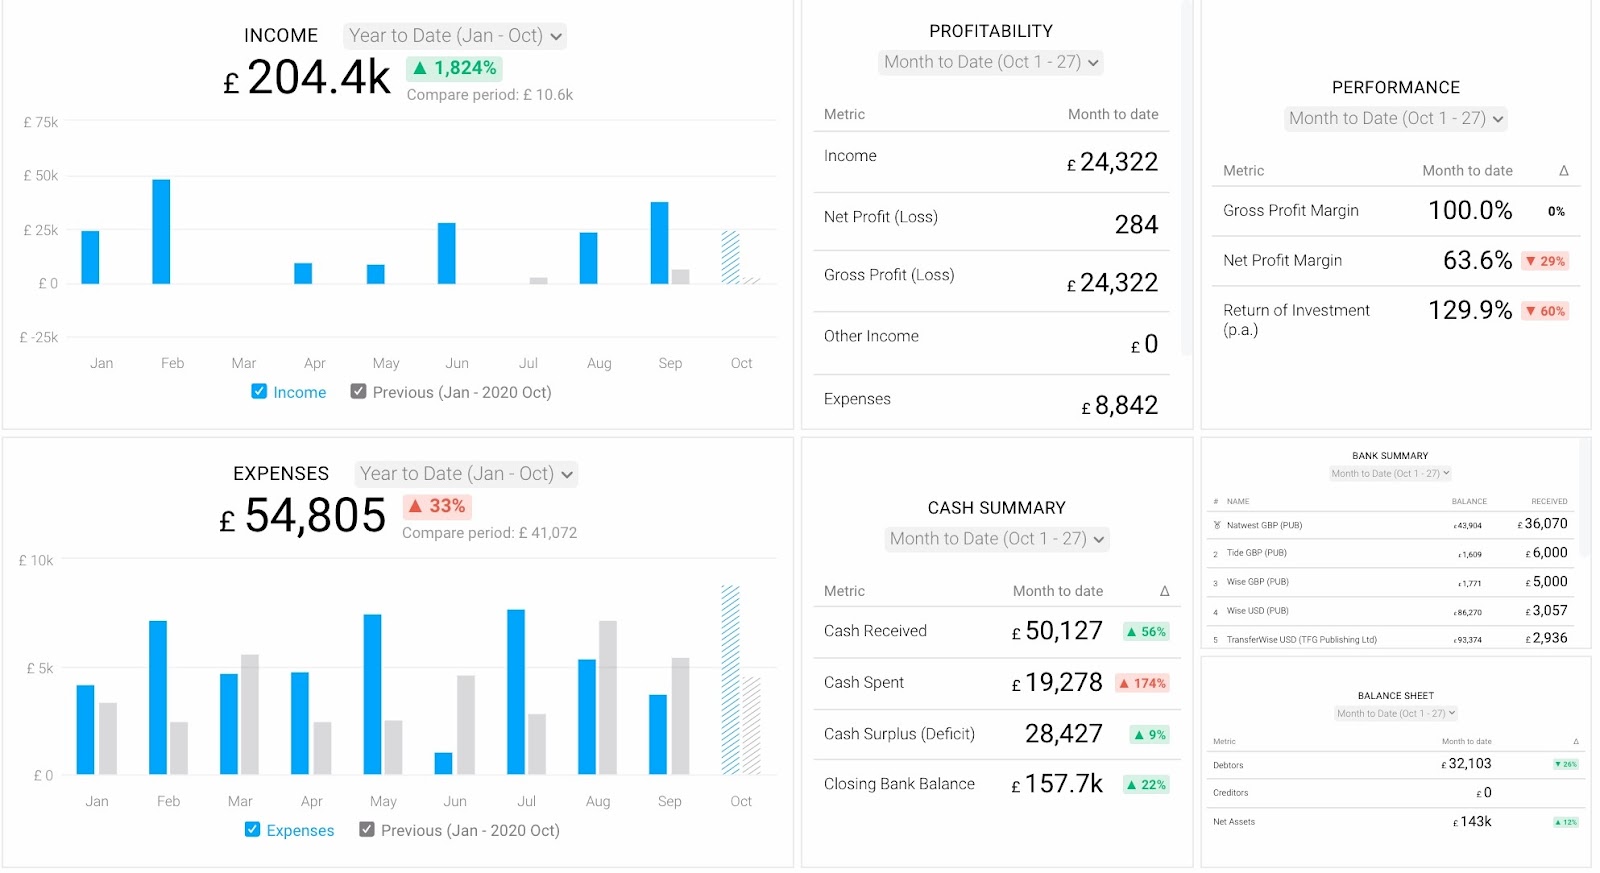
For example, you can use this Xero dashboard to keep an eye on your income and expenses over time.
Rafal Młodzki of Passport-photo.online adds, “I believe that the income statement report is the one that can help a company the most. We perform it at the end of each year, and it provides us with detailed information on the activities that generate the highest profitability or those that are less profitable. It offers us a panoramic view of the company’s performance, providing relevant information for strategic decision-making.”
2. Balance Sheet
A balance sheet provides a bird’s eye of your business’s assets and liabilities (i.e. debt).
“It helps me to compare my assets and revenues and shareholder equity to determine whether I am operating at a profit or loss,” says Goodell David of Woodworking Clarity.
Daniela Sawyer of findpeoplefast.net agrees, “The financial report I rely upon the most contains balance sheets, P&L statements, cash flow statements, and net profit margin over time.
Balance sheet helps me in understanding the assets, liabilities, and company’s equity. Profit and loss statements are helpful in gaining insight into revenue generated in a specific period and I get to learn whether our sales and marketing strategies are proceeding in the right direction or not.
The cash flow statement tells about the manner in which we are conducting our transactions and how money is going in and out of the business.
Lastly, net profit margins show the efficacy of our strategies and indicate the need for improvement or alteration in different market conditions.”
Pro Tip: How to Stay on Top of the Financial Health of Your Business
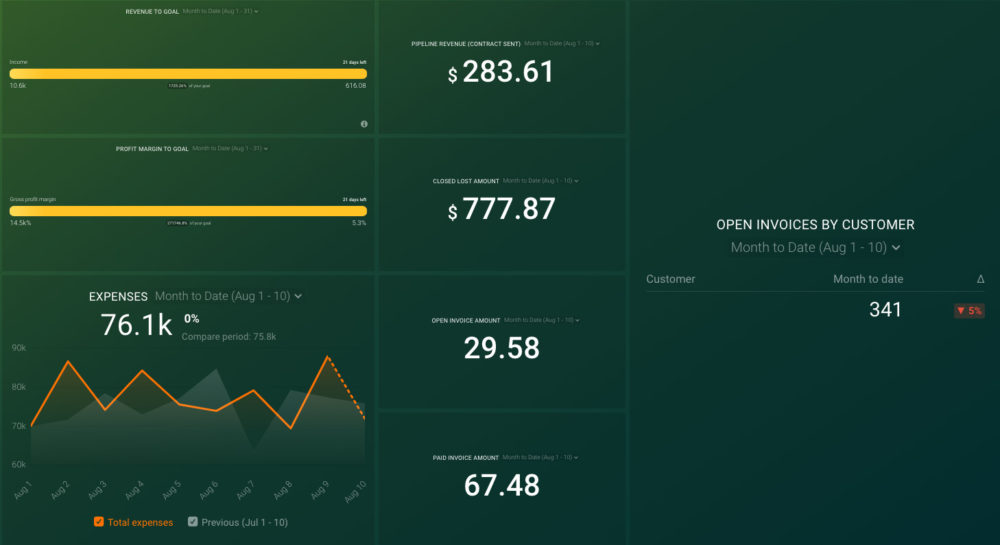
Do you own and manage a small business? Then you know how much of a struggle it can be to stay on top of the financial health of your business on a daily basis. Now you can pull data from QuickBooks and HubSpot’s CRM to track your key business metrics in one convenient dashboard, including:
- Open deals and deal amounts by pipeline stage. Get sales data directly from your HubSpot CRM and track deals, deal amounts, deal stages, and dates from your sales pipeline.
- Key financial data. Track gross profit margin, open invoices by amount and by customer, paid invoices, expenses, and income from QuickBooks.
Now you can benefit from the experience of our HubSpot CRM and QuickBooks experts, who have put together a plug-and-play Databox template that helps you monitor and analyze your key financial metrics. It’s simple to implement and start using it now!
You can easily set it up in just a few clicks – no coding required.
To set up the dashboard, follow these 3 simple steps:
Step 1: Get the template
Step 2: Connect your HubSpot and Quickbooks accounts with Databox.
Step 3: Watch your dashboard populate in seconds.
3. P&L statement
While your balance sheet provides a bird’s eye view, your profit and loss statement can provide you with data on how your business is operating on a monthly basis.
“To me, the most important financial report for a business owner is the P&L,” says Robert Green. “It helps to frame performance at a substantially high perspective and if we know how to drill into the components effectively, we can drive growth and increase profitability and valuation at the same time.”
Larraine Lam of SnowboardHow adds, “A profit and loss statement, also called a P&L or P&L report, is one financial report that I’d suggest getting very familiar with no matter what type of business or organization you own or operate. This statement shows all of the incoming profit and outgoing expenses over the course of a given time period.
P&L’s are essential for tax purposes but also can help you plan and budget throughout the year.
This report can also serve as a way to document successes to see what products or services your business is selling the most.
You can also quickly see when expenses are racking up and make decisions to tighten up the ship accordingly.
I typically keep an eye on my P&L statements once a week and would suggest looking at them at a minimum once a month. The more you understand where profits and losses stand, the better you’ll be able to keep the business on track in the short and long term.”
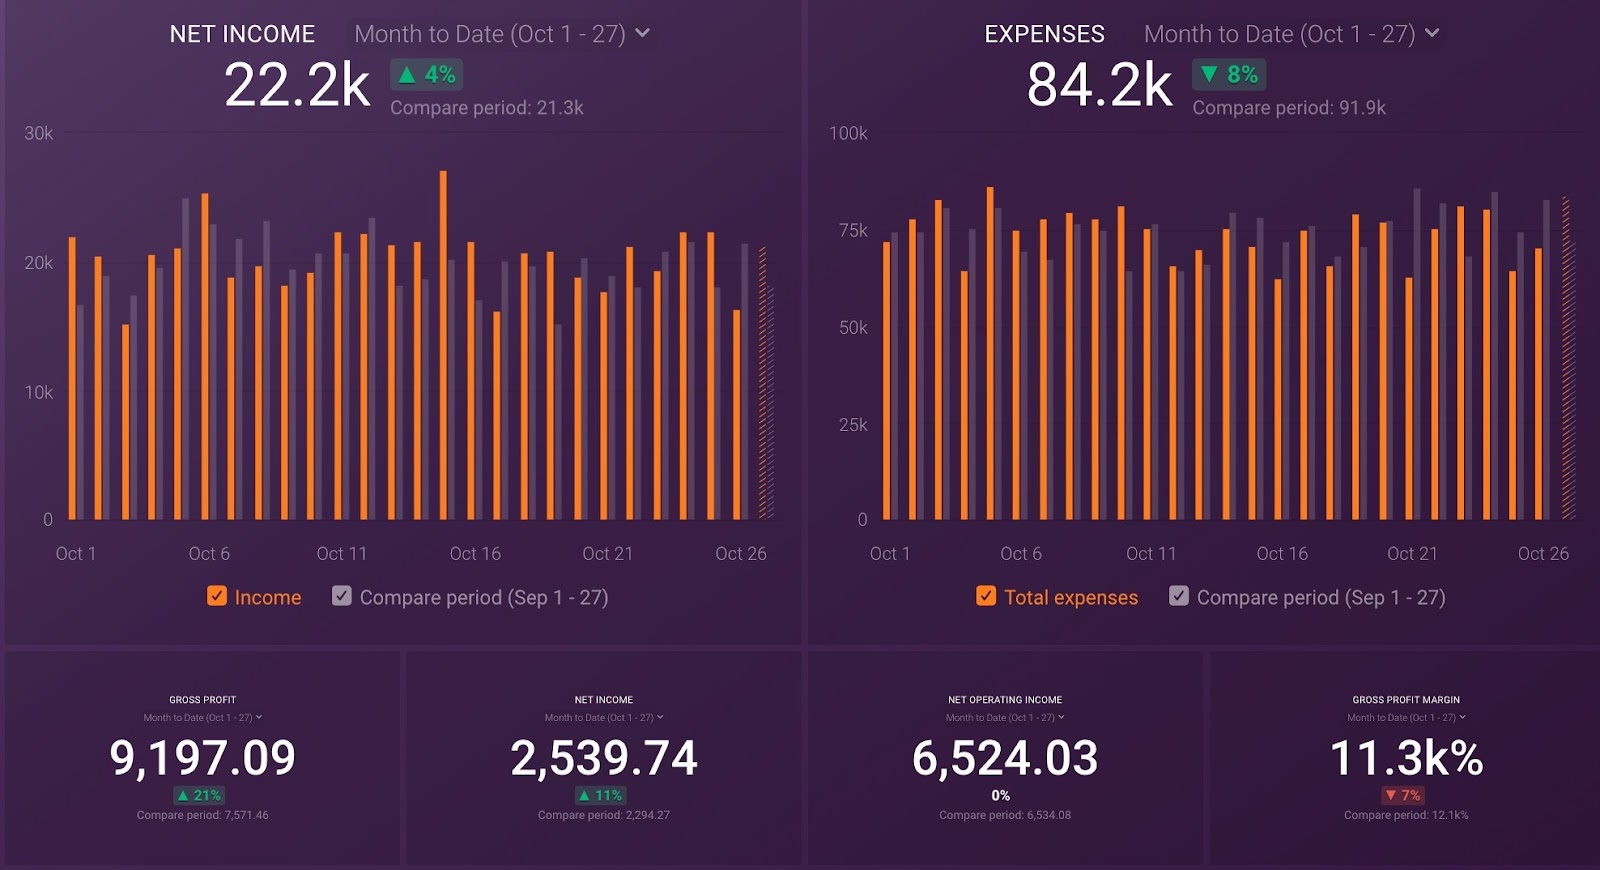
For example, you can use this Quickbooks Profit and Loss Overview dashboard to monitor sales and examples.
In addition, here are some additional profit and loss dashboards that you can review daily, weekly, or monthly.
4. Cash flow statement
A P&L statement is great for reviewing how profitable your business is. However, profit is only part of the equation. You also need to see how much free cash flow you have at any time. As many service-based and eCommerce businesses can attest, you can have a wildly profitable business, but still, have trouble making payroll this month. That’s where a cash flow statement can come in handy.
“Cash Flow Statement combines data from the income statement and the balance sheet to show how money flows in and out of a company,” says Jason Feldman of Immigrate Me. “The cash flow from the operations line on all financial accounts is one of the most significant for a business owner. It displays the net difference between cash that came in and cash that went out on an operating level throughout the time period listed.
Most business owners, in my experience working in banking and consulting, struggle to keep a firm grip on their cash flow. You don’t want to be concerned about how to pay your next expense. You should concentrate on expanding your company. Regularly reviewing cash flow from operations provides a clearer picture of the company’s health, allowing owners to focus on ways to improve performance.”
For example, Andrea Chapman of Nature and Bloom adds, “Ever since the pandemic began, we also resorted our tasks and responsibilities to an online format, and this includes company reports. We use Excel Online as our tool to deliver these reports to the management.
Aside from the convenience, it gives to cater information about the financial status of our business, these digital financial reports further helped us experience a real-time analysis of our performance, compare and contrast the present status to the previous ones through graphs, figures, and concept maps, and clearly classify our strengths and weaknesses in each financial aspect. Moreover, it helped us to manage the cash flow and debts easier and more organized, thus, a better understanding and a more collaborative performance from all of us, plus, it helps our company details more secured and with a reduced risk of leaking information.”
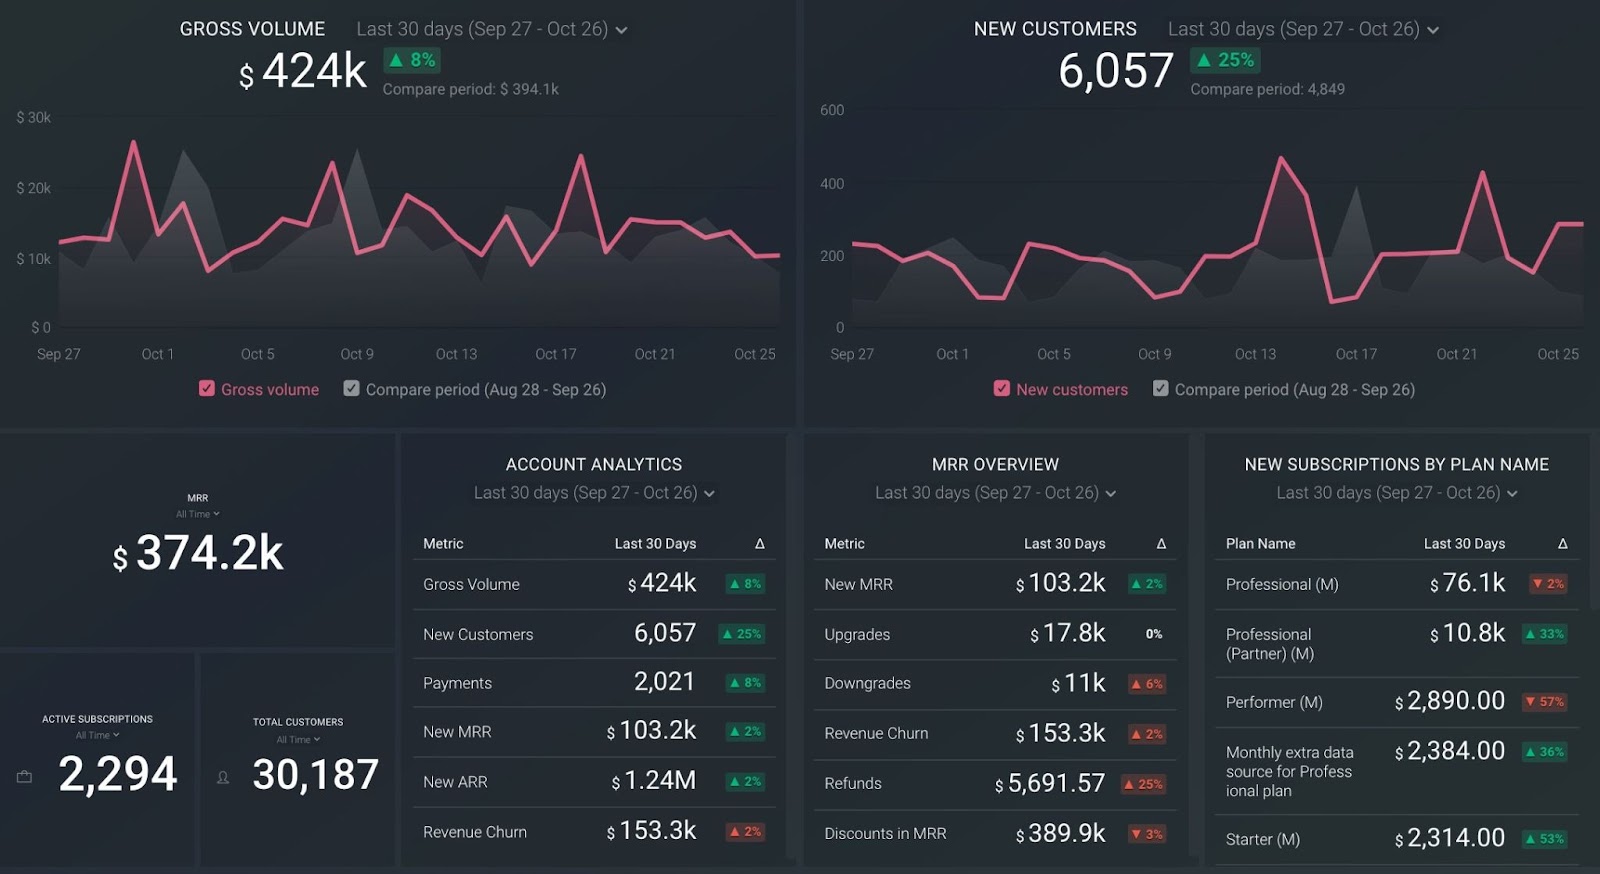
If you don’t want to create your own custom report, you can use this Stripe dashboard to keep tabs on MRR and churn.
In addition, here are some additional examples of Databox dashboards you can use to monitor cash flow.
5. Accounts receivable report
Another financial report that is particularly useful for agencies and service businesses is the accounts receivable report. This helps you see and collect unpaid invoices faster.
“Accounts receivable aging report is highly beneficial for a business or an organization,” says Eden Cheng of PeopleFinderFree. “Inefficiently managed accounts receivable is the crucial cause of a business’s cash flow issues.
Hence, it’s highly recommended for companies to detect slow-paying customer and delinquent accounts quickly. Declining any ongoing service or extra shipment requests to these customers safeguard businesses from benefitting from maintaining financial interests.
Therefore, distinguishing Accounts Receivable (AR) by the length of overdue time, such as 1-30 days, 31-60, 61-90, and 90+ days is mainly hassle-free for the businesses to work within an existing accounting system automatically. Therefore, establishing these reports help organizations take a practical approach to conduct the collections process. Companies need to compare the AR days vs. AP days metric internally.”
In sum, these are the five finance report templates that every small business should use to stay on top of its financial health.


