If you don’t use Google AdSense, you can pull data from any of our 70+ one-click, native integrations or from spreadsheets, databases and other APIs.
By connecting your Adsense account, get answers to the following:
Discover trends such as a steady decline or increase in earnings and impressions RPM, or a sharp dip or spike--dig in to learn why this happened.
What else can you track and visualize with our robust integration with AdSense? When it comes to analyzing your campaigns, pretty much anything:
There are numerous metrics and metric combinations you can track using AdSense. And in Databox, you can quickly visualize dozens of AdSense metrics in various ways.
Read more about Databox’s Google AdSense integration.
The number of times a User Clicked on a standard Content Ad during the specified Date Range.
The amount you earn each time a User Clicks on your Ad during the specified Date Range. CPC is calculated by dividing the Estimated Revenue by the number of Clicks Received.
The amount of Estimated earnings of the Publisher during the specified Date Range. This amount is an Estimate that is subject to change when your Earnings are verified for accuracy at the end of every month.
The amount of Estimated earnings of the Publisher during the specified Date Range split up by Bid Type. This amount is an Estimate that is subject to change when your Earnings are verified for accuracy at the end of every month.
The amount of Estimated earnings of the Publisher during the specified Date Range split up by Country. This amount is an Estimate that is subject to change when your Earnings are verified for accuracy at the end of every month.
The amount of Estimated earnings of the Publisher during the specified Date Range split up by Network. This amount is an Estimate that is subject to change when your Earnings are verified for accuracy at the end of every month.
Number of Impressions during the specified Date Range. An Impression is counted for each Ad Request that returns at least one Ad to the Site. It is the number of Ad Units (for Content Ads) or Search Queries (for Search Ads) that showed Ads.
The Impression Revenue per thousand Impressions (RPM) is Average Earnings per one thousand Impressions during the specified Date Range.
Number of Impressions during the specified Date Range split up by Network. An Impression is counted for each Ad Request that returns at least one Ad to the Site. It is the number of Ad Units (for Content Ads) or Search Queries (for Search Ads) that showed Ads.
The Ratio of individual Page Views that resulted in a Click during the specified Date Range.
The Revenue per thousand Page Views during the specified Date Range. This is calculated by dividing your Estimated Revenue by the number of Page Views multiplied by 1000.
Number of Page Views during the specified Date Range. A Page View is what Google counts in your reports every time a User Views a Page displaying Google Ads. We count one Page View regardless of the number of Ads displayed on that Page.
Total number of Estimated Earnings. No historical data is available from before the initial connection.
Sometimes, you’ll want to dive deeper into performance. When you need to customize this template (or any other dashboard) to include different metrics, add metrics from different sources, etc., you can do so by using Databox’s Dashboard Designer.
The Designer allows you to easily drag-and-drop metrics and visualizations from any data source right into your dashboard.
Visualizing your performance data in a way that’s easy for everyone to interpret is the first step toward actually improving performance. So, what can you do when any of these metrics is trending down?
We’ve collected a few resources that contain tips from hundreds of other paid marketers on how to improve your overall campaign performance and maximize revenue:
Didn’t find what you’re looking for? Start a conversation with our experts
Creating your account...
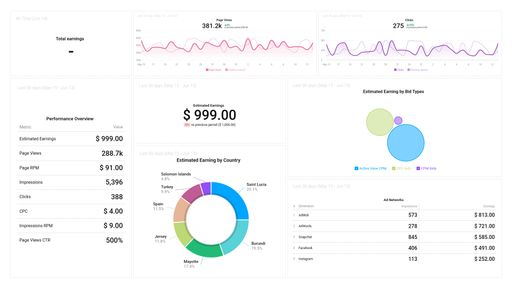