


Table of contents
Statistics, charts, ROI. Are you struggling to connect all the data in a way that indeed proves the value to your clients?
You may not be sure how detailed you should be. Or what metrics are the most important ones to include and how to organize them in an easy-to-follow way.
We get it. Preparing reports for clients can be demanding, especially when you’re trying to showcase your results in the best light possible and justify their trust… and budgets. You may know you’ve done a great job, but making sure they know it too is a different story.
This guide will walk you through client reporting, explain why it’s important, and share tips on what agency reporting software and hacks you can use to create digestible, to-the-point reports that your clients will understand and love.
Jump to the section you’re most interested in:
- What Is Client Reporting?
- 6 Reasons Why Client Reporting Is Important
- How to Prepare a Client Report
- Client Reporting Best Practices and Tools
- Client Reporting Hacks
- Client Reporting Examples
- How to Automate Your Agency’s Client Reporting with a Databox Agency Account

What Is Client Reporting?
Client reporting is the best way to display the results your campaigns and other activities achieve for your clients. A report you prepare for the client typically contains the relevant data gathered over a specific period (week, month, year), organized in an easy-to-follow manner so the client can understand what you did and how it affected their business.
Client reports are typically created in PowerPoint, Excel, and different data visualization tools, as you usually use charts, tables, and graphs to display the data.
An average report contains data collected by tracking metrics such as website traffic, ad spend, social media engagement, number of leads, source of traffic, ROI, CTR, and more.
6 Reasons Why Client Reporting Is Important
If you think client reporting is a waste of time and something you can scratch off from your to-do list, think again. It has more benefits than you know. For starters, here’s 6:
- It Helps Establish Trust
- It Improves Communication
- It Keeps You and Your Client Accountable
- It Helps Your Celebrate Your Success and Learn from Errors
- It Helps Your Clients Learn
- It Helps You Improve Your Work
1. It Helps Establish Trust
Providing regular reports to your clients makes your job easier, although it seems like adding more to your plate at first. A client who knows what you’re doing and has insight into your results will trust you more and won’t demand daily meetings while trying to micromanage you. This will leave you more room to focus and work on providing even better outcomes.
2. It Improves Communication
Transparent communication is the key to keeping your relationship with your clients on a high level. Notifying your clients about changes in campaign performance, whether they’re good or bad, and doing it regularly (weekly or monthly) keeps the communication going and helps tackle any problems as soon as they occur.
3. It Keeps You and Your Client Accountable
You can create good results only if you and your client are working together. That means they need to provide you with all the necessary information to identify and measure the right metrics you’ll later share in a report. This information typically includes specific goals they want to achieve and that you can report on. This way, both sides are accountable and have clear expectations of each other.
4. It Helps You Celebrate Your Success and Learn from Errors
When you sum up your campaigns and other activities in a report, you have a chance to celebrate your success with your client and showcase the excellent results you’ve achieved. It will motivate you to keep up the good work. On the other hand, you also have an opportunity to analyze potential mistakes and plan how to avoid them in the future.
5. It Helps Your Clients Learn
Most clients want to know what you’re doing, even if they don’t know much about marketing. By using reports, you can help them learn more about their own KPIs and how they can grow their business even more. If they understand your processes, they’ll feel involved and be more likely to trust you.
6. It Helps You Improve Your Work
By regularly communicating and sharing reports with your clients, you learn to improve your work on so many levels. You can get better at reporting by finding ways to represent the data in an easy-to-understand way, and you’ll be able to improve your processes by identifying possible hiccups or obstacles. Leveraging marketing reporting software can help a great deal with repetitive client reports.
PRO TIP: How Well Are Your Marketing KPIs Performing?
Like most marketers and marketing managers, you want to know how your efforts are translating into results each month. How is your website performing? How well are you converting traffic into leads and customers? Which marketing channels are performing best? How does organic search compare to paid campaigns and to previous months? You might have to scramble to put all of this together in a single report, but now you can have it all at your fingertips in a single Databox dashboard.
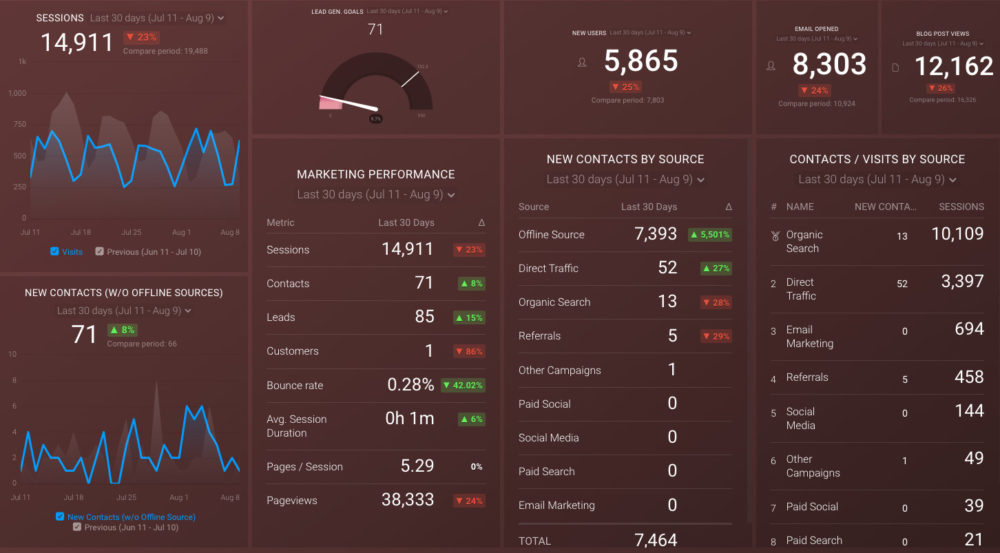
Our Monthly Marketing Performance Dashboard includes data from Google Analytics 4 and HubSpot Marketing with key performance metrics like:
- Website sessions, new users, and new leads. Basic engagement data from your website. How much traffic? How many new visitors? How many lead conversions?
- Lead generation vs goal. Did you reach your goal for lead conversion for the month, quarter, or year? If not, by how much did you miss?
- Overall marketing performance. A summary list of the main KPIs for your website: sessions, contacts, leads, customers, bounce rate, avg. session duration, pages/session, and pageviews.
- Email response. Overall, how effective were your email campaigns, measured by email opens?
- Blog post traffic. How much traffic did your blog attract during a certain period?
- New contacts by source. Which sources drove the highest number of new contacts
- Visits and contacts by source. How did your sources compare by both sessions and new contacts in a certain period of time?
Now you can benefit from the experience of our Google Analytics and HubSpot Marketing experts, who have put together a plug-and-play Databox template that contains all the essential metrics for monitoring and analyzing your website traffic and its sources, lead generation, and more. It’s simple to implement and start using as a standalone dashboard or in marketing reports!
You can easily set it up in just a few clicks – no coding required.
To set up the dashboard, follow these 3 simple steps:
Step 1: Get the template
Step 2: Connect your HubSpot and Google Analytics 4 accounts with Databox.
Step 3: Watch your dashboard populate in seconds.
How to Prepare a Client Report
Writing an effective client report doesn’t need to be a complicated task. Actually, you can do it by following these 5 simple steps.
- Interview Your Client
- Choose the Right Metrics
- Pick Suitable Tools
- Determine How and When You’re Going to Share Reports
- Include a Summary
1. Interview Your Client
Detailed preparation will facilitate your job when you sit down to write the report. If you’ve already learned all there is to know about the client’s goals, you’ll know precisely what statistics, metrics, and KPIs to include in your report.
It all starts with a clear definition of the goals your client is looking to accomplish. You can ask your client about their overall business goals, their marketing goals, and goals for a specific project you’re working on. Also, try to learn as much as possible about their target audience and how the client wants their brand to be perceived.
2. Choose the Right Metrics
Before starting your project and any activities and campaigns, make sure you and the client are on the same page when measuring specific metrics and KPIs.
Maybe your client already has an idea about what they’d like you to measure and include in the report. If not, ensure you present them with the options and explain why specific metrics matter in their case.
The chosen metrics will depend on your client’s goals and the type of project you’re working on.
3. Pick Suitable Tools
Creating digestible client reports is much easier when you have the right tools. Gone are the days when we had to use spreadsheets and presentations to visualize and manually update the data – now, there are many data analytics tools available, and they come with plenty of benefits.
These tools will allow you to monitor the chosen metrics in real-time, collect them in one place, and analyze them in a straightforward way. They usually visualize data using pie charts, graphs, and tables, so you can utilize them to create well-organized reports that your clients will find easy to follow.
4. Determine How and When You’re Going to Share Reports
It’s critical to determine the optimal frequency of sharing reports with your clients. Some will want you to provide updates weekly, while others will choose to have a monthly meeting where you’ll showcase your results.
Whatever you agree upon, it’s essential to set clear goals and expectations for your reports and allocate enough time for you to collect and analyze the data and your client to give any feedback.
5. Include a Summary
Don’t forget to include a few brief paragraphs where you’ll state the project’s (or campaign’s) goal and the most important results you’ve achieved. This summary is an overview of the report that highlights the key findings that the client can skim over before the meeting, so they’re up-to-date.
The summary is also an excellent way to avoid getting lost in too much data and numbers – it’ll help your client focus on the critical results and make the meeting more productive. And if this summary also includes a short overview of the past month’s results, the report can be even more effective as you can see how much progress you’ve made.
Instead of spending precious time on writing summaries, have company performance scorecards automatically delivered to your client. Automate your first KPI Scorecard for free now.
Client Reporting Best Practices and Tools
Every client comes with their specific needs. However, if you’d like to save time and avoid testing different strategies to learn what works best for your clients, we’re sharing the best practices and tools that will undoubtedly save your energy and help you create top-notch client reports.
- Personalize the Report
- Make the Report Readable
- Make Time to Discuss the Report
- Include Explanations
- Don’t Overcomplicate It
- Review Your KPIs
- Use the Best Tools
1. Personalize the Report
Working with clients from different industries may call for adjusting your reports.
And even if your clients are from the same field, their marketing knowledge and personal preferences may vary. Some will prefer all data presented in pie charts, while others will want tables. Some will need explanations for different abbreviations, such as CPA or ROAS, while others will understand them perfectly.
Make sure you don’t use the same template for everyone but adjust the report to the client.
2. Make the Report Readable
You may feel tempted to include as much data as possible. However, remember that the whole point of your report is to underline the most important results and help the client understand how they affect their business. You should include as much as necessary to demonstrate the value of your work for the client.
Therefore, the report should be clear, appealing, well-organized, and neat, with data split into digestible chunks of information that will prove your progress.
3. Make Time to Discuss the Report
After you submit the report to the client, there should always be room for the two of you to discuss the data included in that report. Without the client’s comments, you won’t know if they’re happy with the results or still have the same goals. Without your comments, the client may not understand the whole report.
That’s why a reporting meeting should always follow a report, so you can revisit the guidelines and goals and adjust your strategy if necessary.
4. Include Explanations
Figures won’t mean much to your client without any additional explanations from your side. If they see their CTR for search ads is 3.22%, how will they know if it’s good or you need to up your game to get better results?
Don’t hesitate to include notes and your thoughts in the report. These notes prove your dedication, make it easier for the client to understand the information you’ve provided, and increase trust and good communication between you and your client.
5. Don’t Overcomplicate It
Using complex charts and too many details will make the report hard to read and interpret. Don’t forget that you’re the expert that your client chose to hire – you’re the one who’s supposed to understand all those figures.
On the other hand, your client is only interested in the most impactful ones – typically those linked to website traffic, conversions, revenue, and social media engagement.
6. Review Your KPIs
Determining your KPIs once doesn’t mean that your job is done and that you’ll be using the same KPIs forever. Experts recommend revisiting the client’s business goals and your marketing goals from time to time (quarterly, for example) to ensure you’re still on the same page.
If you discover your (and your client’s goals) have changed, it’s time to revisit the KPIs and other essential metrics and shortlist them or add new ones to track to match your new goals.
7. Use the Best Tools
Automation has brought many benefits to marketers – one of them is that you can create beautiful, easy-to-follow reports for your clients and easily include the data collected from different sources.
Testing and experimenting will help you choose the tools that fit your and your clients’ needs, but we’d still like to offer a selection of the most popular reporting tools that some of the world’s leading experts trust — Google Analytics, Google Search Console, HubSport Marketing, HubSpot CRM, SEMrush, and more.
Client Reporting Hacks
Experienced marketers know a few secrets about the client reporting process that could help you save time and energy, prove the value of your work, and avoid common mistakes that may make your report inefficient or messy. Here are the top three tips to follow.
- Demonstrate the Value of Your Services to Clients
- What to Avoid in Client Reports
- Automating Client Reporting with Databox
1. Demonstrate the Value of Your Services to Clients
Client reporting is an excellent way to continue the great job you’ve done by welcoming a new client to your agency. Your reports will include many important metrics, but the truth is that most clients will focus on revenue more than anything else. That’s why selling your results rather than hours may work best to demonstrate your value.
What do we mean? Use the pay-per-sale model.
It’s a commonly used digital advertising model where you get paid a commission after your activities have led to a conversion or a sale. That means you’ll earn money by providing results, and you’re not afraid to rely on your strategies because you believe in your value.
However, we know small advertising agencies or freelancers may not always be able to implement this model. For them, it’s important to show off their leads, not only by numbers but by their actual names listed out. To ensure these are quality leads, you can introduce surveys that will draw the line between unqualified leads and those interested in your client’s service.
2. What to Avoid in Client Reports
There are two critical mistakes people make when writing reports. First of all, they hide unsatisfactory results from their clients, and secondly, they include way too much unnecessary information.
If your campaign hasn’t met your expectations (and the client’s neither), you need to be honest in your report. It’s critical to be oriented towards solving the problem and analyzing the data to pinpoint what went wrong and fix it in your next campaign. Hiding bad results will hurt your communication and relationship with the client more than being upfront about them.
Another thing to avoid is to go too in-depth, believing that it’s the more, the merrier when it comes to data in your client reports. Your client probably doesn’t have time to read 20 pages of campaign results and focus on every single metric you’ve included. Moreover, they may not understand all the data without your interpretation. You should only include the most important KPIs in your client report, so they can keep up and benefit from reading the reports.
3. Automating Client Reporting with Databox
Although it’s an essential marketing activity, people sometimes spend way too much time on client reporting, meaning they’re wasting their precious time on crafting reports instead of analyzing them and planning the next steps – actually working for the client.
Is there a better way to create reports? Optimize the process and make it more efficient?
Luckily, yes. With Databox dashboards, client reporting becomes an automated activity, which not only saves your time but also helps you:
- Identify red flags in your data before they become significant issues
- Identify positive trends and try to replicate the activities that caused them
- Keep your client in the loop effortlessly and more frequently
And it’s all thanks to access to your data in real-time. That provides you with a unique opportunity to act promptly as soon as you notice a hiccup or a chance to leverage any spikes of activity. (See more details here.)
Client Reporting Examples
To illustrate our point, we’ll include a few examples of client reporting dashboards. Remember that you can download them for free and save your time and energy by avoiding crafting a dashboard from scratch.
- Monthly Marketing Performance Overview Report Example
- Paid Search Report Example
- SEO Campaign Performance Report Example
- Website Analytics Report Example
- Social Media Report Example
Monthly Marketing Performance Overview Report Example
This dashboard provides your client with everything they need to know about your marketing performance. It answers questions such as:
- Where does your traffic come from?
- How many new users does their website have this month?
- What’s the ROI of your marketing activities?
- Have you reached your lead generation goals this month?
And more…
Download this marketing dashboard right away to make your reports effective and well-organized effortlessly or browse more marketing dashboard examples here.

Paid Search Report Example
If your marketing strategy includes Google Ads, your client will appreciate seeing the data in this easy-to-understand dashboard.
Thanks to a neat overview of the most critical metrics and KPIs, such as impressions, CPC, conversions, and more, you can easily monitor the performance of your campaigns and report on their success and ROI to your client. Download the PPC dashboard for free or browse through other PPC dashboard templates we offer.

SEO Campaign Performance Report Example
To easily track your SEO efforts and learn what pages on your client’s website perform best for organic clicks and sessions, you can use this Google Analytics Landing Page SEO dashboard. Discover the following with this template:
- Which landing pages drive the most organic traffic?
- Which landing pages need optimization?
- Which queries drive visitors to land on your website?
And more…
Identify the strength of your on-page SEO by downloading this free SEO dashboard template right away or find your perfect fit by browsing through more than 100 SEO dashboard examples here.

Website Analytics Report Example
Is your client’s website successfully driving new traffic, engaging readers, and converting them into leads or customers? This is some of the data your client will want to see in the report. Use one of our dashboard templates to collect it effortlessly and create an at-a-glance overview of the most important website analytics metrics.
For example, with this free Google Analytics Website Engagement dashboard, you can track bounce rate, average time on page, goal conversion rate, and other relevant metrics. Download the free website analytics report now or browse through all of our prebuilt web analytics dashboards here. Whatever template you choose, you will be fully prepared for your next reporting meeting.

Social Media Report Example
Every client wants to know if their following has grown over the last month. Use this free Social Networks dashboard to provide your client with crucial information, such as total page views, engagement rate, number of impressions, and more. Tracking these metrics in real-time allows you to react timely if there’s an issue.
This dashboard template is fantastic because it helps you monitor everything in one place – download the free social media report now or browse through all of our social media dashboards here to start ramping up your social media marketing.

Automate Your Agency’s Client Reporting in 5 Quick Steps with a Databox Agency Account
Client reporting is essential for a good and ongoing relationship with your clients.
Moreover, it helps you do your job more efficiently and learn how to create successful campaigns and generate great results.
You can improve your client reporting process immensely by automating how you create reports and using these free client tracking dashboard templates so you don’t have to make from scratch. They save your time and enable you to craft visually appealing, easy-to-understand client reports that will contain all the relevant data in one place – data that you can easily pull from any tool you may be using.
Agencies usually sign up for a Databox agency account because they want to stop spending a ridiculous amount of time compiling client reports on a monthly basis.
Some agencies also want to become more agile by optimizing client results on a daily or even hourly basis. Or, they want to put their hard-earned results in front of clients more consistently.
Based on feedback from our inaugural partners, our product team has streamlined our app so agencies can automate their entire reporting workflow. They can do this in less time than it usually takes to manually create monthly reports for one client.
Here are the first 5 things you should do to eliminate cutting and pasting forever.
0. Sign up for a Databox agency account here

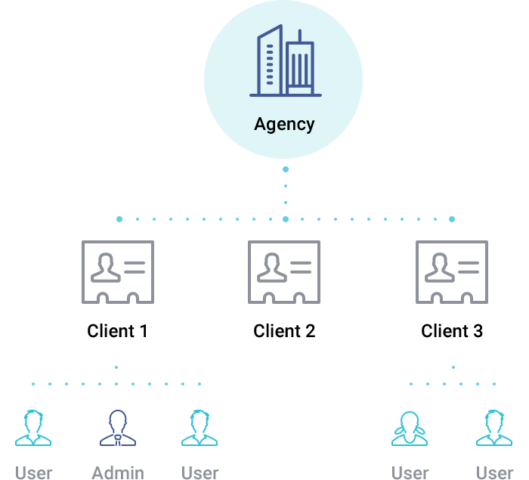
1. Create a Client Account in Under 60 Seconds
Once you create your own agency account, you can quickly create client accounts under yours. This allows you to manage your client’s account for them or manage it alongside them if they want to be more involved. It ensures you never accidentally share one client’s data with another. You can also leverage mobile alerts and notifications to report successes to each client as they happen.
This step couldn’t be easier! All you have to do is click “add new accounts” here. Here are full client account creation instructions if you want to read them. Or just watch the animated gif below to see the full process.

Think of your agency account as a research and development area where you create templates and reports that can be rolled out to client accounts. Reports created in a parent agency account can be transferred to the child client account. So, you can create standard templates within your agency account and re-use them with every client.
Once you have templates you love, setting up a new prospect or client can be done in minutes.
2. Connect Your Data Sources By Logging in to Each Service
Just like creating clients accounts, adding data sources is simple. Databox has direct integrations with dozens of digital services including Facebook Ads, AdWords, HubSpot Marketing, HubSpot CRM, Google Analytics, SEMRush, and Salesforce. You just need to select which of these systems you’d like to pull data from, then login using OAuth to connect the systems permanently. (Oauth lets you login to our system without giving us your password for each account.)
On our free plan, we pull data once per day. On our other plans, we pull data hourly.
Because each of your client accounts is separate, you will need to connect data sources inside each client account or inside your agency account.

3. Leverage Pre-Built Templates to Quickly Automate Reporting
Agencies use Databox to easily view data from multiple software systems in the format and flow they desire.
With most other business intelligence tools, you must design every report from scratch.
At Databox, we think that’s pretty silly. The software we all use — especially SaaS — have codified which metrics we should all be tracking. For example, Google Analytics has standardized metrics like sessions, users and pageviews, while HubSpot has popularized concepts like Marketing Qualified Leads and Opportunities.
At Databox, we take the time to understand the metrics from each of our integrated apps, pull them in via our native connectors and instantly visualize them in our template directory. For example, we pull 138+ metrics from HubSpot alone and have created 100+ HubSpot templates. This way, you don’t have to re-invent the wheel.
The report template directory helps you set up your initial client reports within minutes. In the template directory, you can quickly choose from a list of 100+ pre-made Databoards that pull the metrics important to you or your client. Some also use the template directory to find inspiration for advanced reporting options they hadn’t thought of themselves already.

Even if you start with a template, you can still use our Report Designer tool to make tweaks to it.
As a bonus, partners who come up with a brilliant report can submit it to be included as a template in our directory, complete with your branding. For example, Stream Creative’s SEMRush Keyword Ranking Report is one of our most popular.

4. Quickly Clone Your Reports Into a Client’s Account
After your reports are set up at the agency level, send them into your client accounts in one click.
Once you send Databoards to the appropriate client, toggle into the client’s account to accept the Databoard and connect the appropriate data sources. The report will then be populated with your client’s metrics.

As an aside, it’s important to note that while you can send templates from the agency level to client accounts, this does not work both ways. In other words, if you create a template in the client account, it can’t be sent up the tree to the agency.
By following this report cloning process, you can pick and choose which clients receive which reports.
There are many reasons to vary your reporting from client to client.
- The marketing sophistication of your clients might vary. Sometimes, you might be working directly with a business owner or CEO who might care a lot less than an in-house marketer about specific details on each individual marketing tactic or campaign. CEOs may just be interested in high-level performance metrics like traffic, leads and sales. But, in-house marketers may want detailed reports on performance of each marketing channel.
- Clients use different software. Some clients might use MailChimp, while some might use HubSpot or Campaign Monitor.
- Different levels of reporting create opportunities for agencies to charge for their reporting capabilities. You can develop more advanced views in your sales reporting software to help with finance or sales reporting, for example, or do deep dives on SEO using SEMRush and Google Analytics data for clients who are invested heavily in content marketing. Then, you can charge clients for the effort of creating and interpreting the health of their entire business, as well as the success of your marketing services. Here’s an agency that’s offering reporting-as-a-service.
If you run into scenarios like these, it’s critical for you to automate your reporting. If you do your reporting manually, it’s almost impossible to vary reporting client by client. One person cannot easily keep track of different reporting needs across multiple clients, especially as the reporting needs change over time. But, when you’re automating the data pulling process, this kind of variation becomes easy.
5. Brand & Rollout Reports to Clients
With Databox, you can customize the look, feel, and flow of your reports so that each client believes you built it just for them.
To customize the look and feel of the reports, go to the top panel of the designer and change the visual settings. You can alter the background color to match their branding, or add a watermark image to denote the type of data you’re presenting on that particular report, add their logo, and customize the text describing each report.
Some agencies stop here. Instead of cutting and pasting data from multiple systems with different formatting into a Powerpoint, they cut and paste Databoards into Powerpoint instead. They rationalize that some clients would be more confused or more demanding if they had access to real-time data.
But, if you’re ready to take the transparency plunge by sharing real-time reports with clients, you can set up each client’s reports in a continuous presentation cycle. To do this, adjust the streaming carousel settings to create a sequence of Databoard reports. Looping or sequencing databoards is a great way to steer the conversation with clients even when you’re not there when they’re viewing the data OR tell the right story while presenting the data live, similar to the way you might use a Powerpoint presentation.
For example, you might show a report with high-level marketing funnel metrics like social media followers, website visitors, leads, deals, and revenue. Then, you could have a second report that does a deeper dive on the performance of your social media posts as tracked using a social media dashboard software, a third report showing traffic by source, a fourth report, and so on. As they click through the reports on their own or listen to your live presentation, you can tell the right narrative.
If you are accustomed to using Powerpoints where you manually add explanations, interpretation, and recommendations, consider using our Notes feature instead. If you can get your clients to monitor the data and read your notes on their own, you can then turn your monthly check-in meeting into a conversation about what’s next, not a conversation about why things did or didn’t work.
Once you set up a carousel, send your clients the streaming URL so they can bookmark it and check it anytime. (If you want that URL to be a subdomain of theirs, Databox can do that too, at no extra cost.) With the URL, they will have the ability to view up-to-date data. But, unless you want them to, they cannot access the Designer and make any changes to the Databoards. However, if you make changes, they will be reflected in the streaming URL (e.g. you won’t need to send out an updated link).
If you really want the stellar results you’re producing to stay front and center, tell them to download the mobile app. With no additional setup required on your part, they will be able to access their data on their phone. And if you want to get really fancy, set them up to view their KPI reports on a TV in their office or home, or connect their Slack account.
Take Your Client Reporting to the Next Level
With these simple five steps, you can save your agency hours of cutting-and-pasting hell each month. With the saved time, you can either make your engagements more profitable or spend more time moving the client’s needle.
But, don’t stop after completing these 5 steps. Databox also gives you the opportunity to:
- Track goal achievement more closely
- Quickly let anyone in the agency see if metrics are trending in the wrong direction without clicking into 100s of screens in different systems
- Alert yourself when issues arise
- Alert clients when your team improves specific metrics
- Leverage our template directory and your analytics prowess to quickly identify new insights and make the case for additional services.
- Stream any dashboard to your TV
This must sound like it’s too good to be true, doesn’t it? Seeing is believing, so don’t believe what we’re saying, and see for yourself that we’re both good and true. Sign up for our free trial, and let us help you create and deliver beautiful client reports that will be the cherry on top of the fantastic service you provide.


