Table of contents
Have trouble setting and tracking goals for your business, your team or yourself? You’re not the only one. An oft-requested feature, we’ve officially rolled out the ability to set targets within Databox.
“A goal properly set is halfway reached,” said motivational speaker Zig Ziglar. By setting numeric, black and white goals, you and your team will have a compass guiding your decisions. By tracking your progress in real time, you will immediately know how your activities correlate to your aims, and will be able to adapt quickly to ensure the outcomes you desire.
Watch this short video tutorial to learn how to enter goals and track your progress towards your goals, both within Databox.
If you prefer text and pictures, follow the directions below.
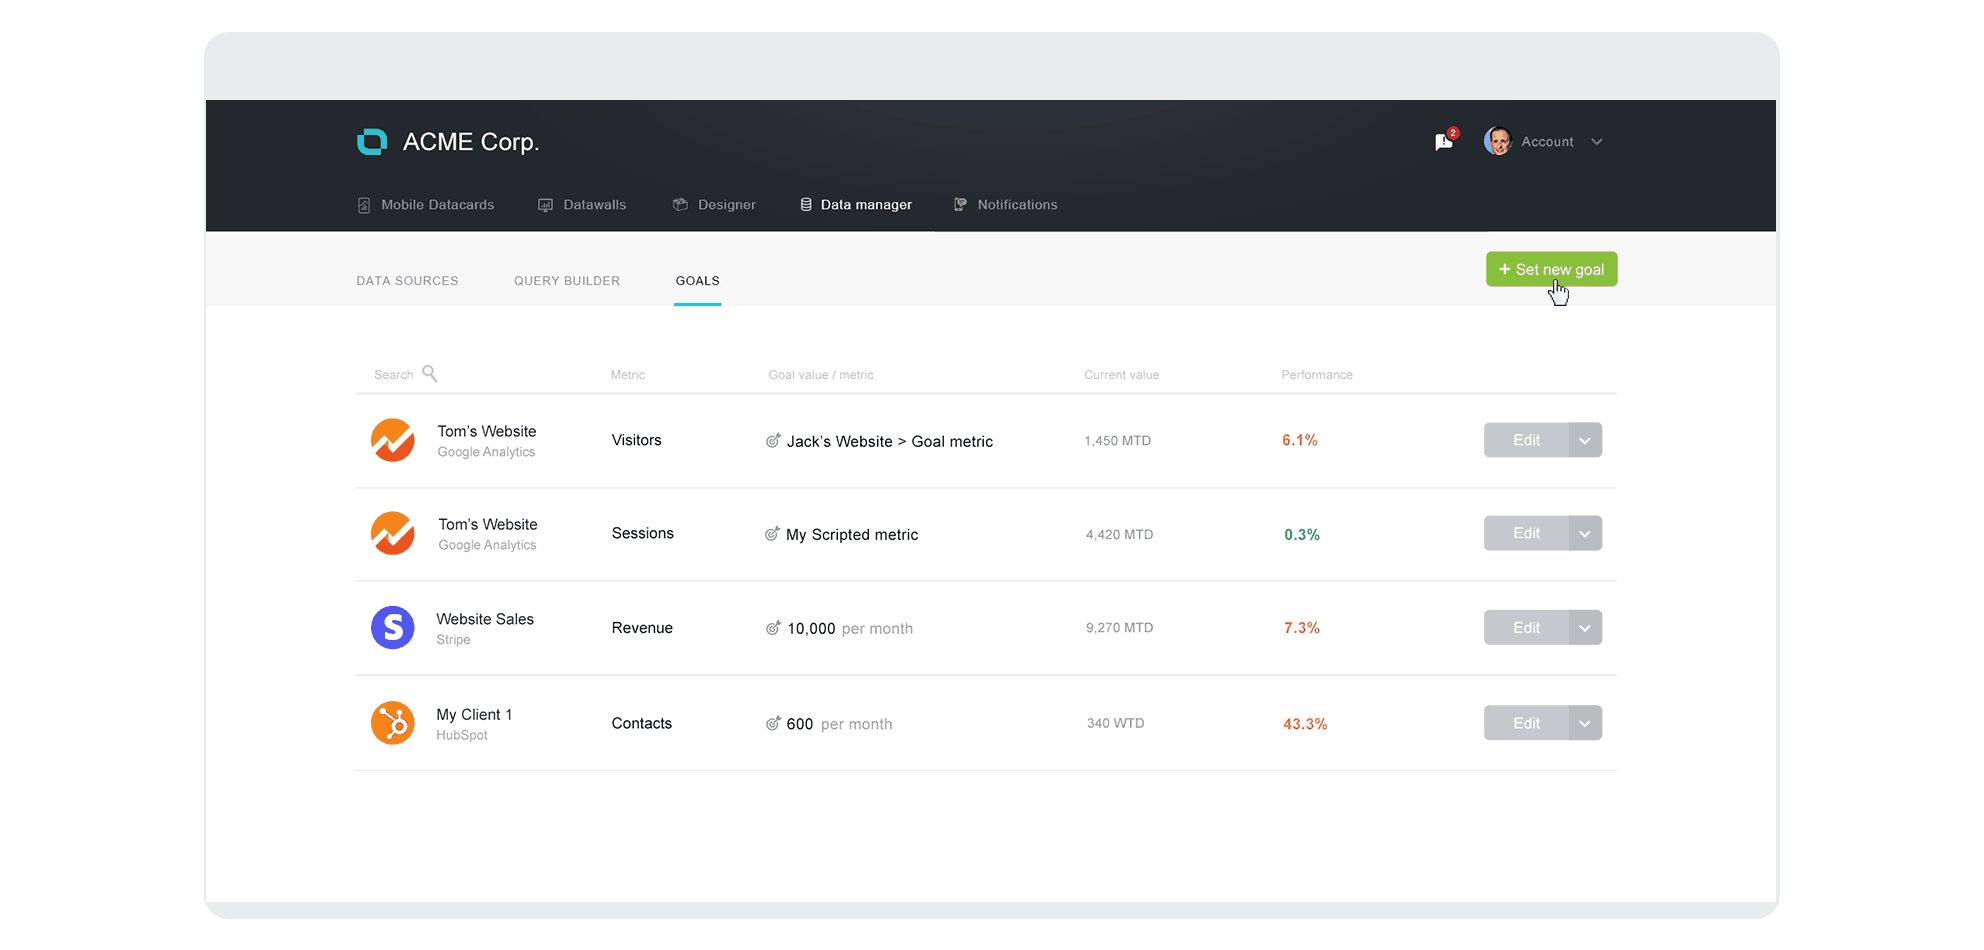
First, navigate to the new Goals screen under Data Manager. Once there, you can click “Set new goal” to create a new goal. If you know your targets, this is the most efficient way to add them. You can view and edit all of your goals on this screen too.
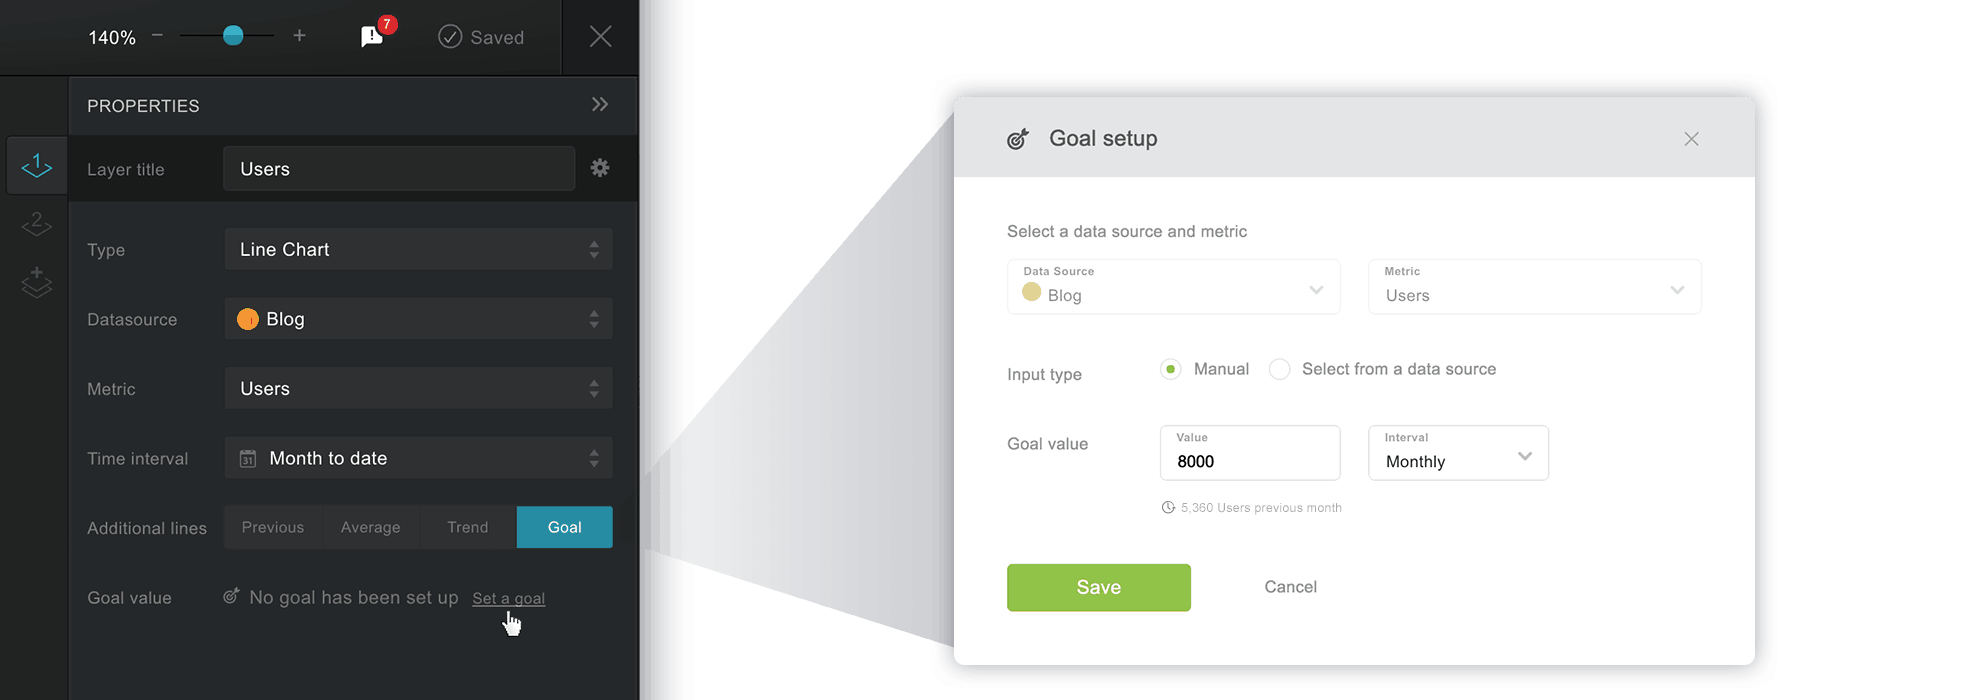
If you don’t know your targets off of the top of your head, you might find it easier to set your goals right within the Databox Designer. Setting goals is easier in the Designer because you can see your current performance and increment your goal from there. In case you’re new to Databox, the designer is the same place you design your datacards (ie. mobile reports) and datawalls (ie. reports for your desktop or TV screen).
To demonstrate, let’s use an example. Let’s say you want to grow traffic to 8,000 sessions per month, you’ve already connected your Google Analytics account to Databox and you’ll monitor your progress using a line chart.
Within the designer, click goal and a popup window will appear. Select ‘Google Analytics’ as the datasource and ‘Sessions’ as the metric. Click the ‘Manual’ option by selecting the radio button, then, enter ‘8000’ for the goal value and select ‘monthly’ from the interval drop down.
If you’d prefer to set an annual goal, you can do that by selecting annual from the drop down. The app gives you the ability to set weekly, monthly, quarterly or annual goals.
No matter what time interval you choose, the visualizations will adapt accordingly. For example, if you have a line graph datablock showing month to date data, and you’ve set a monthly goal, it will simply present the monthly goal. But if you set your line graph to a time interval of ‘week to date’, it’ll divide the monthly goal by the days in the month and multiply it by 7, since there are 7 days in a week. For example, the goal in the graph on the right hand-side below adapted automatically based on the time interval of ‘week to date’.
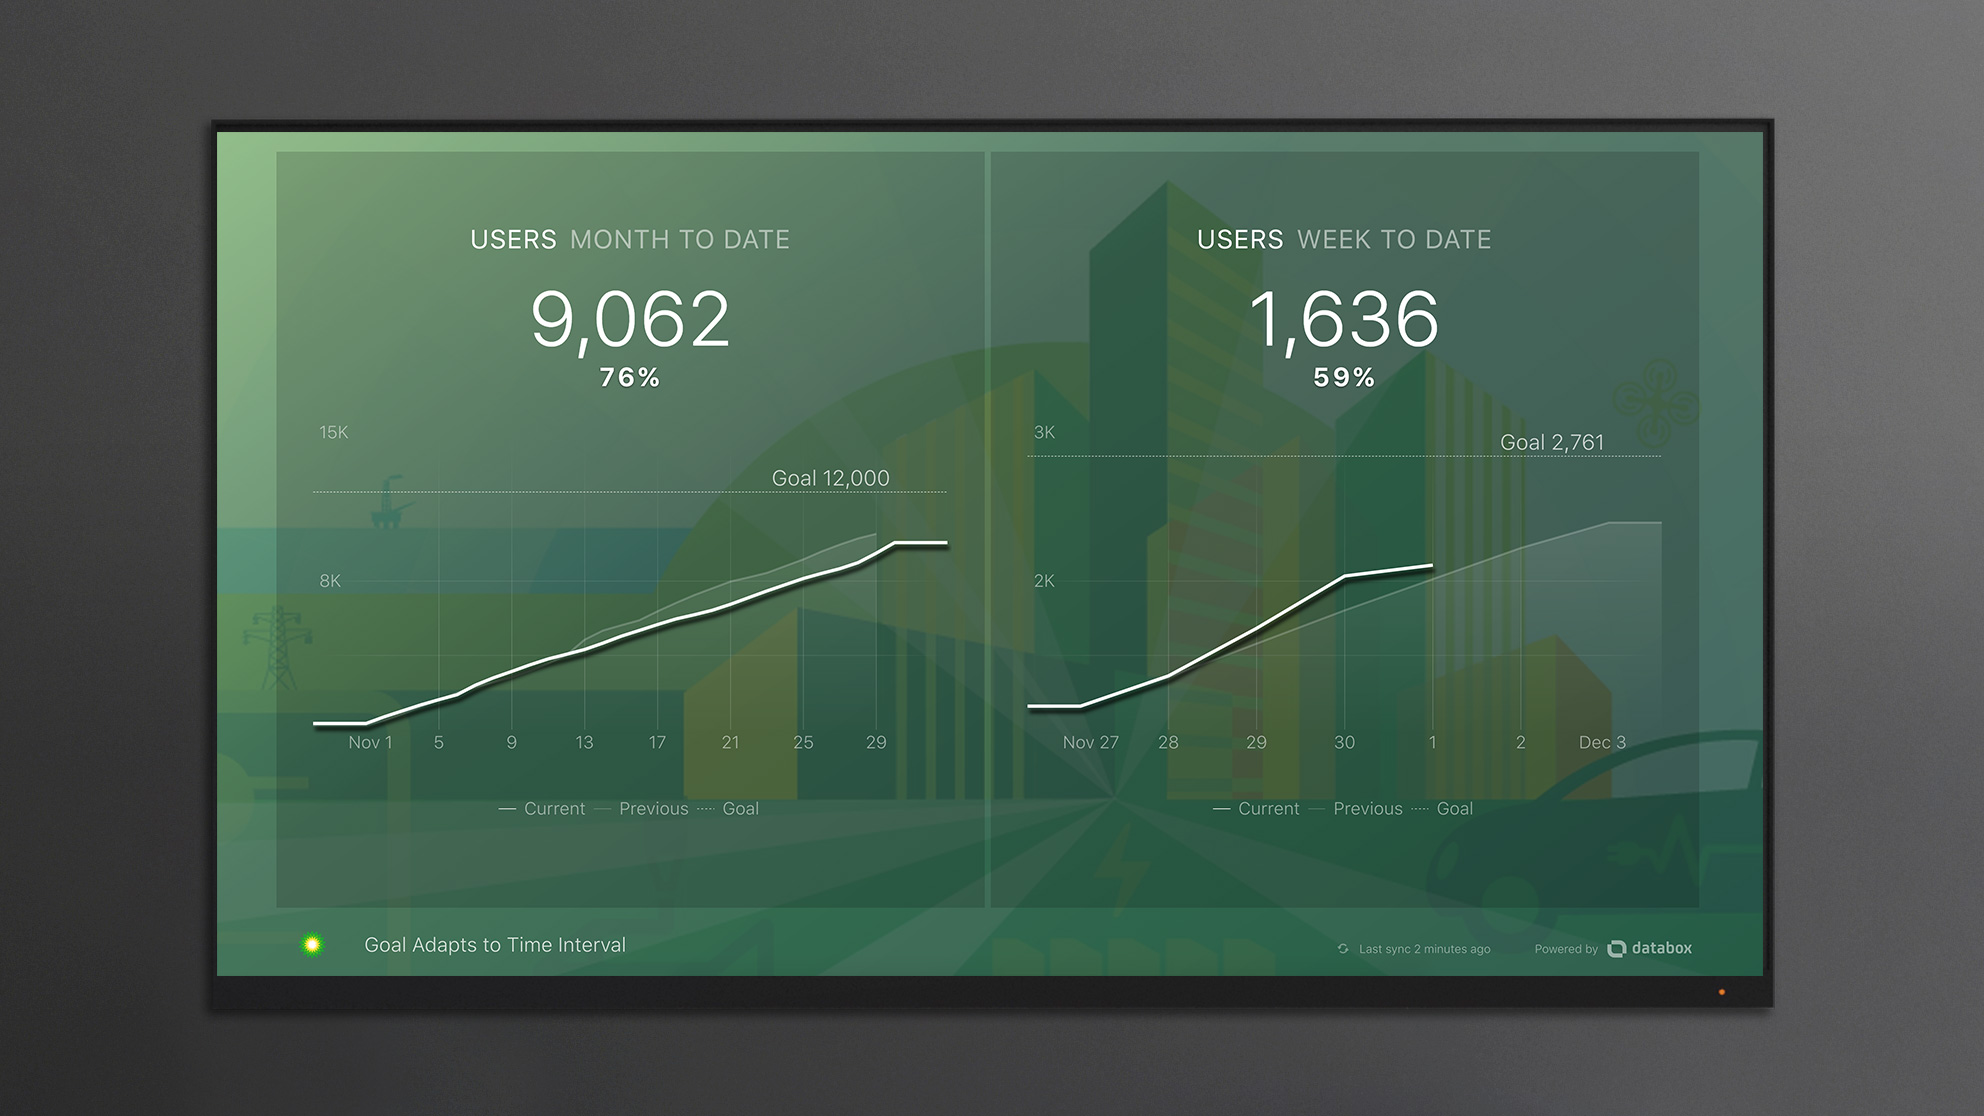
(When the system must adapt the goal to the time interval of a chart, it always converts the goal to a daily value and then multiplies it by the number of days in the week, month, quarter or year, depending on the time interval used in the chart. This way, your goal will be correct no matter how many days are in this month, this quarter or this year year. In effect, it knows when it’s a leap year and it knows which months have 28, 30 or 31 days. It’s smart like that.)
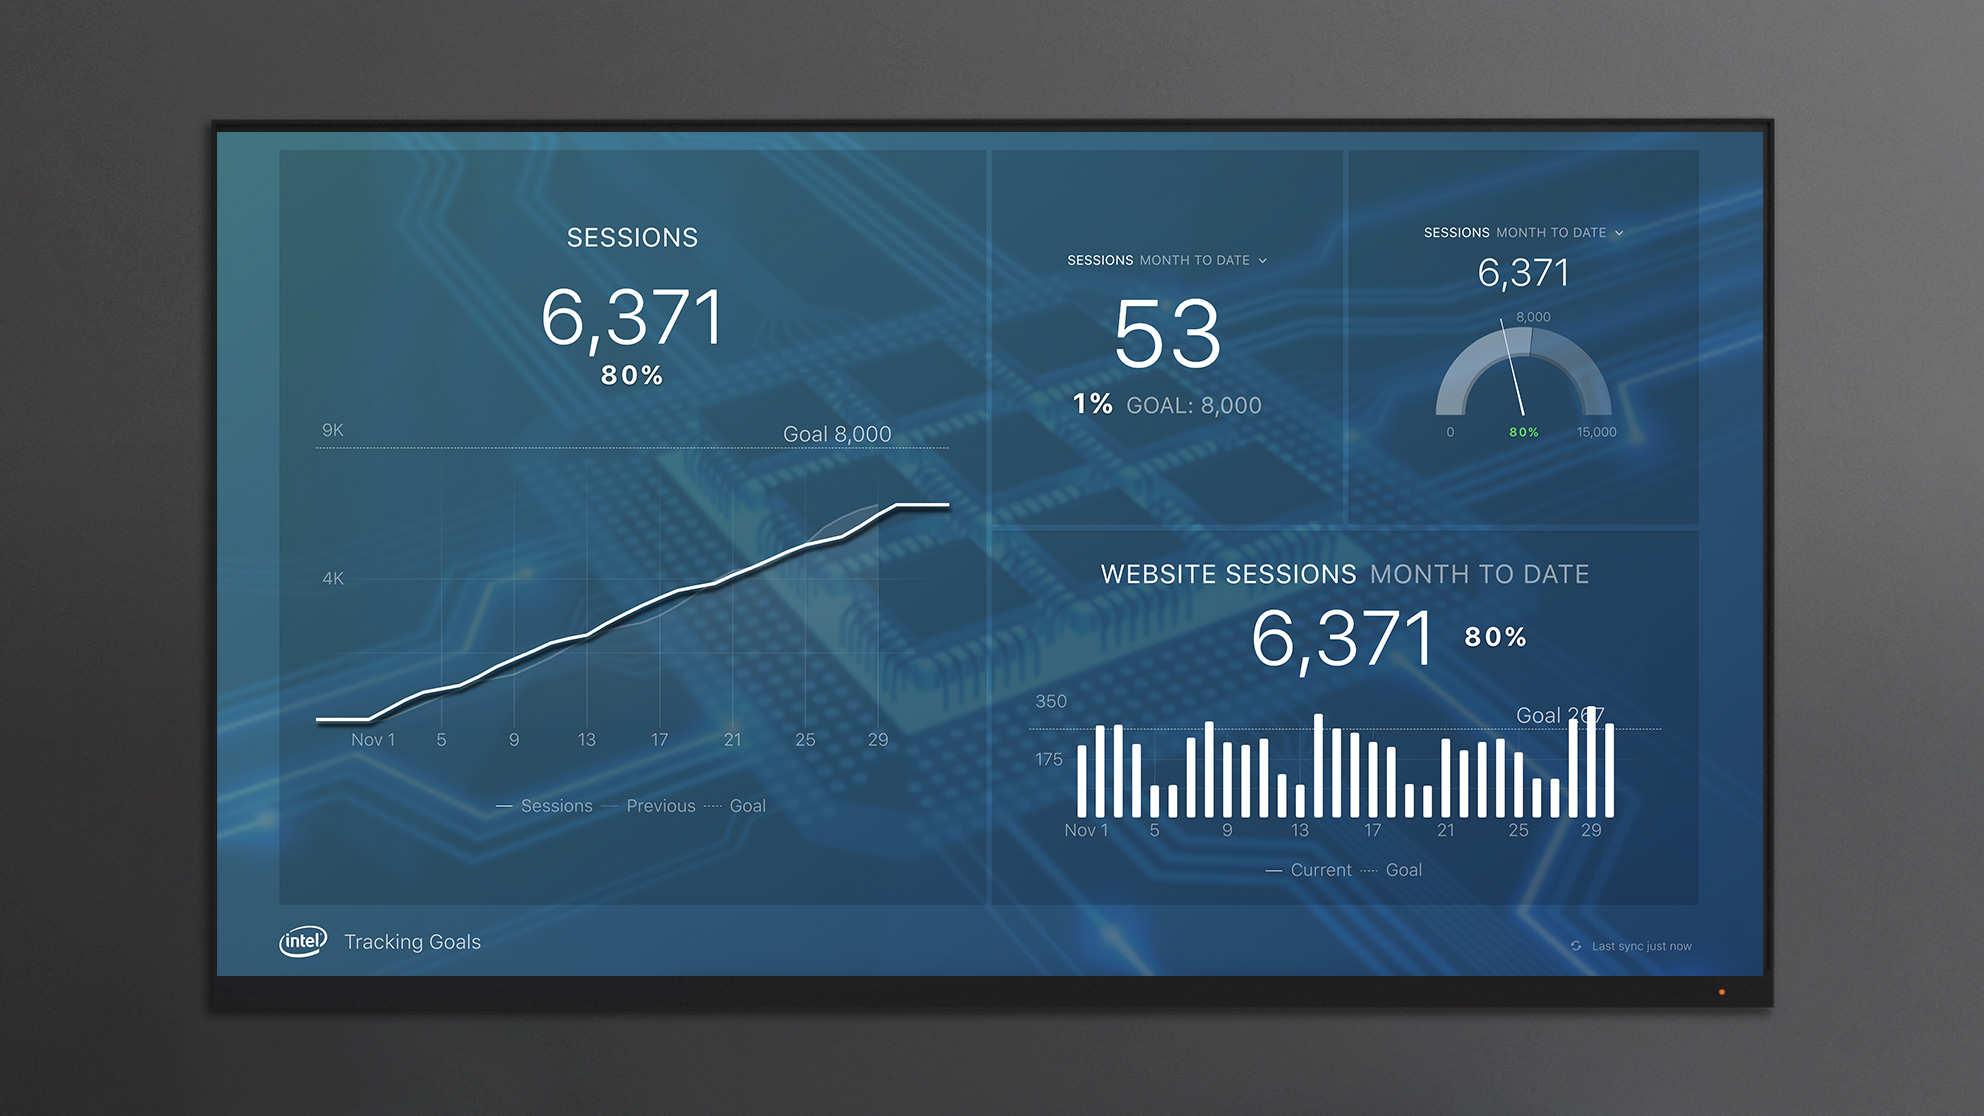
There are four different ways you can visualize your progress against your goals. Shown in the graphic below, they include:
- A line chart. (Left)
- A number block (Top middle)
- A gauge chart. (Top right)
- A bar chart (Bottom right)
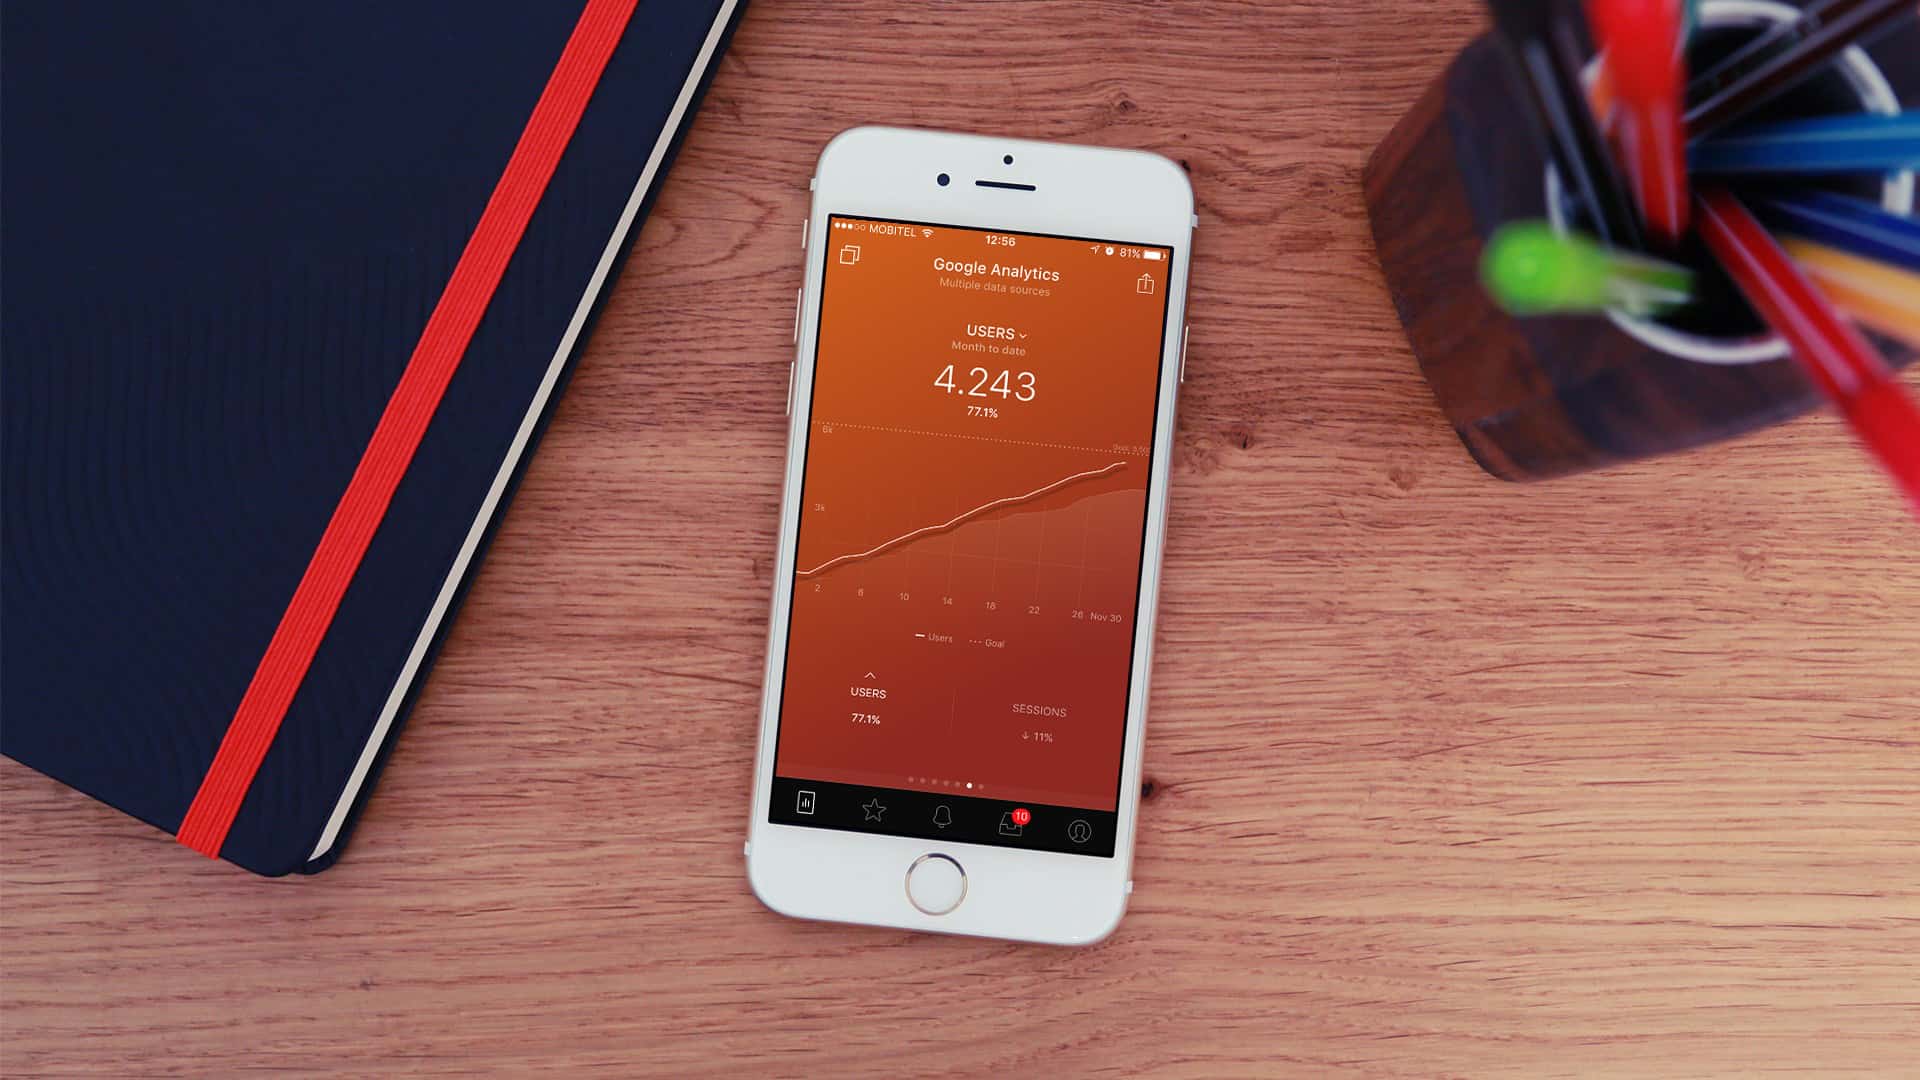
You can also view any of these datablocks in the mobile app, of course.
Start Monitoring Your Achievement
As Zig Ziglar said, setting goals is half of the solution. (Okay — maybe he didn’t say that exactly.) But, unless you monitor your progress towards your goals constantly, you’ll still be flying blind. Monitoring helps you know when you need to adapt your strategy, your plan or your activities. Should you do more of what you’re doing, try something new or even consider a different goal?
With the ability to set and track goals, Databox now helps you answer these questions.
Don’t keep it a secret! You’ll be more likely to achieve your vision if you share your goals with others and work as a team to achieve them. Maybe you should even talk about what the goals should be together, like the group below is doing.

So, go set and track goals for your company, your goal and your team. If you offer services to clients that involve helping them achieve goals, consider using Databox to help them set and track goals too.
If you’re struggling with what goals to set or how to come up with reasonable targets, here’s some goal setting suggestions.