Start a Free Trial, No Credit Card Needed
Everyone starts with a free 14-day trial of our Growth plan, with access to all advanced analytics features. Then choose any plan that best suits your needs.
Creating your account...
A Help Scout Docs Dashboard enables you to track, visualize and monitor all of your most relevant customer support metrics and KPIs. This dashboard will help you learn how responsiveness to user inquiries affects satisfaction, discover categories with the most views, see best-performing articles and more. Enabling you to make data-driven decisions regarding your customer support strategy and documentation.
Your Help Scout Docs Dashboard should include all of your most important customer support metrics pertaining to your help documentation. Some of the metrics that should be included in your Help Scout Docs dashboard are Visits, Article Views and Article viewed per Visit, Top Articles by Name, Failed Searches by Search Term andTop Category Views. These will provide you with more insights into how helpful users find the help documentation you are creating and if you need to adjust your approach and strategy.
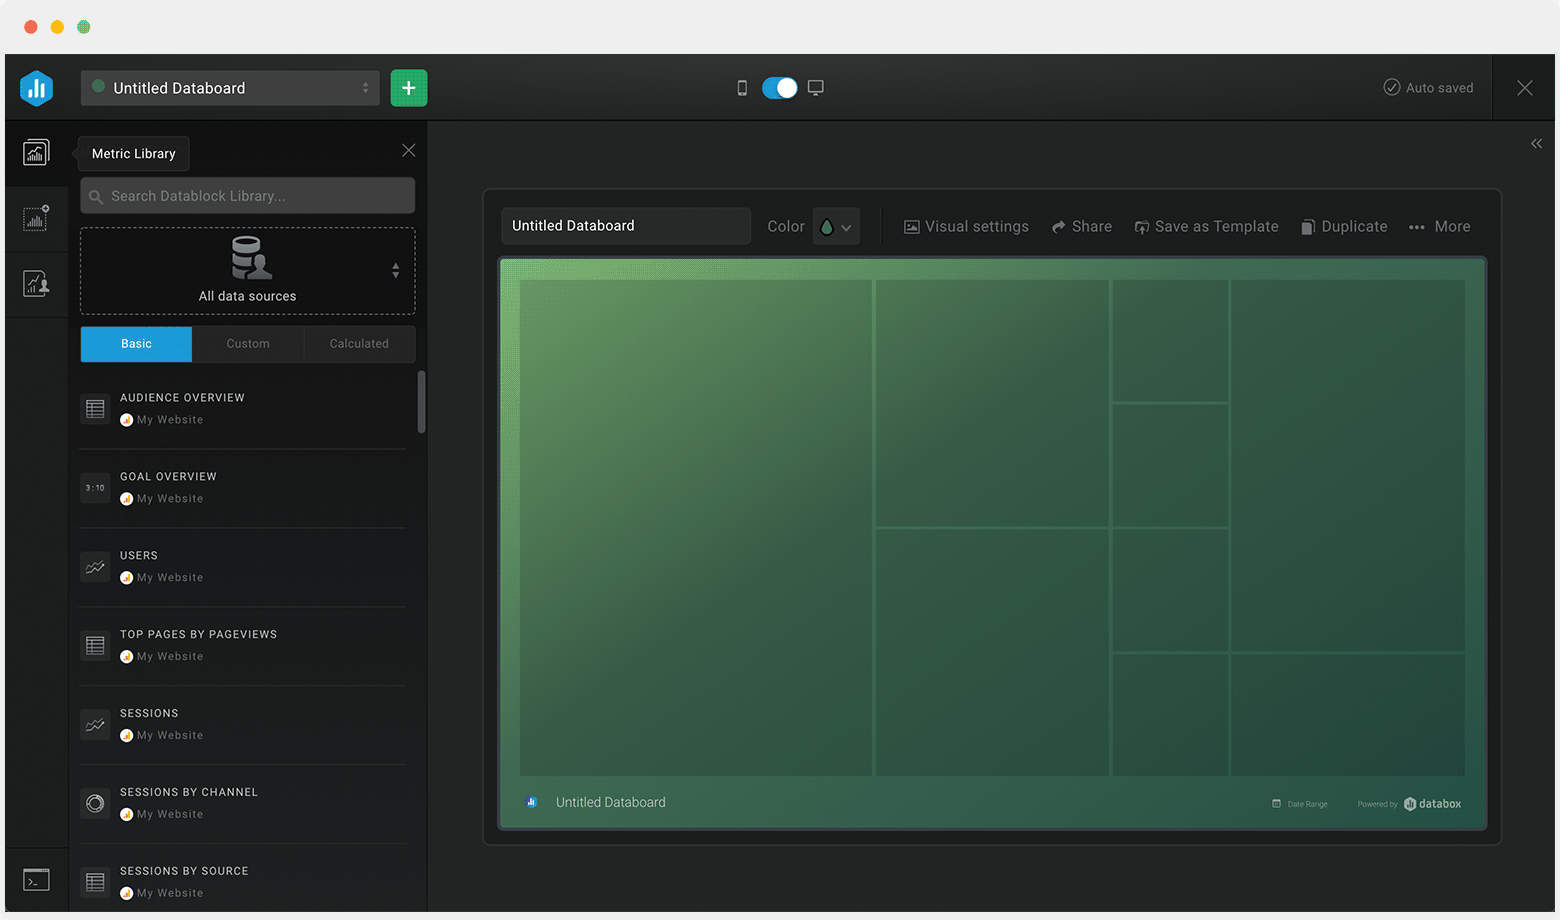
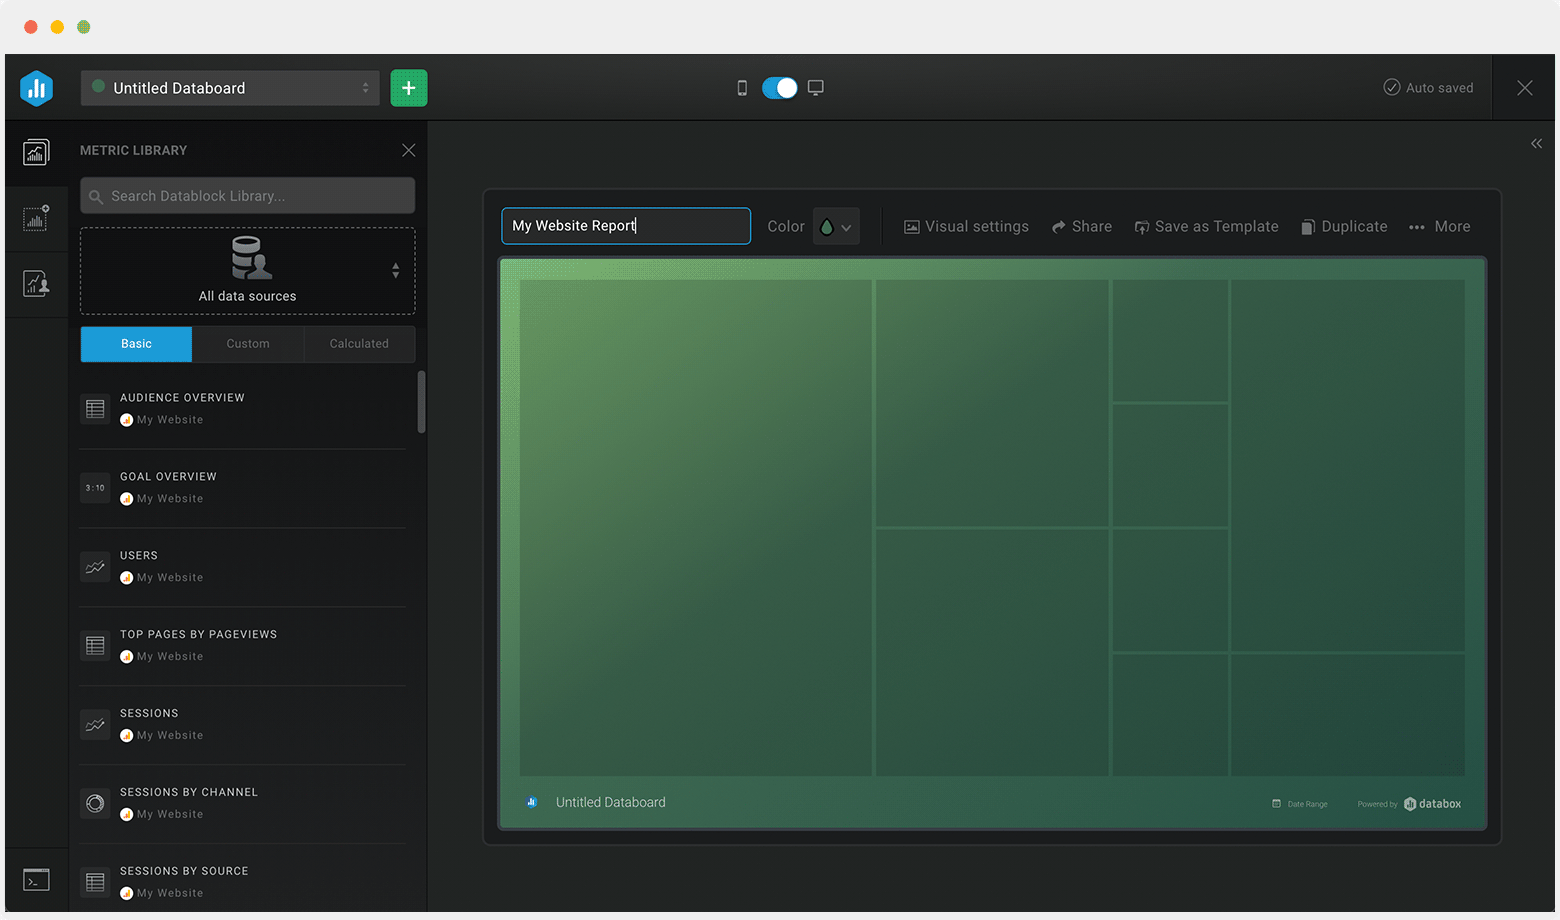
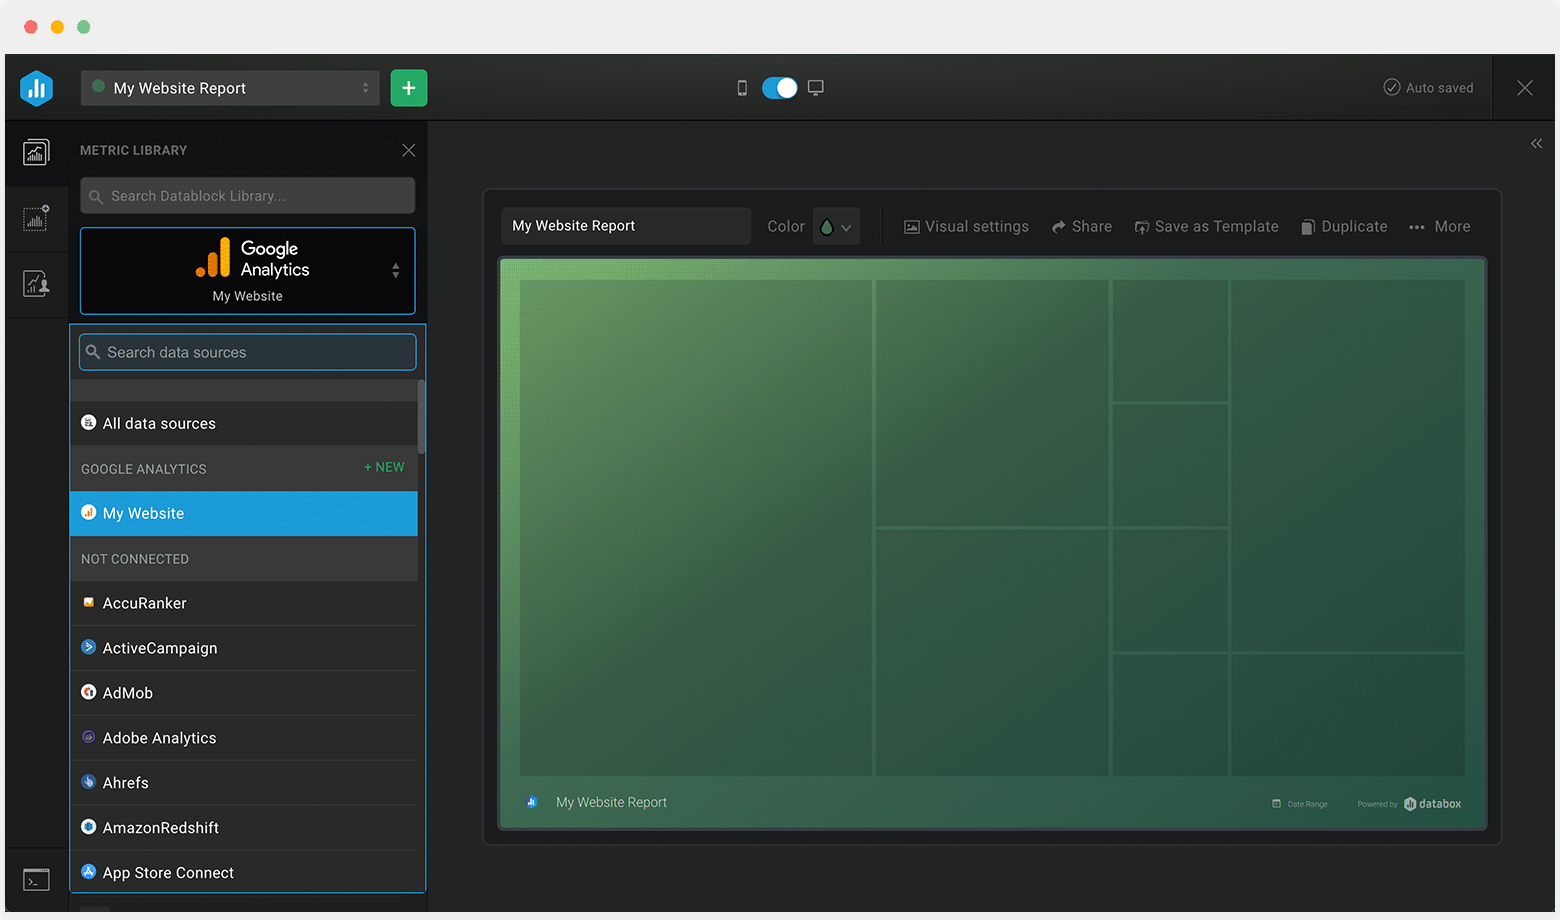
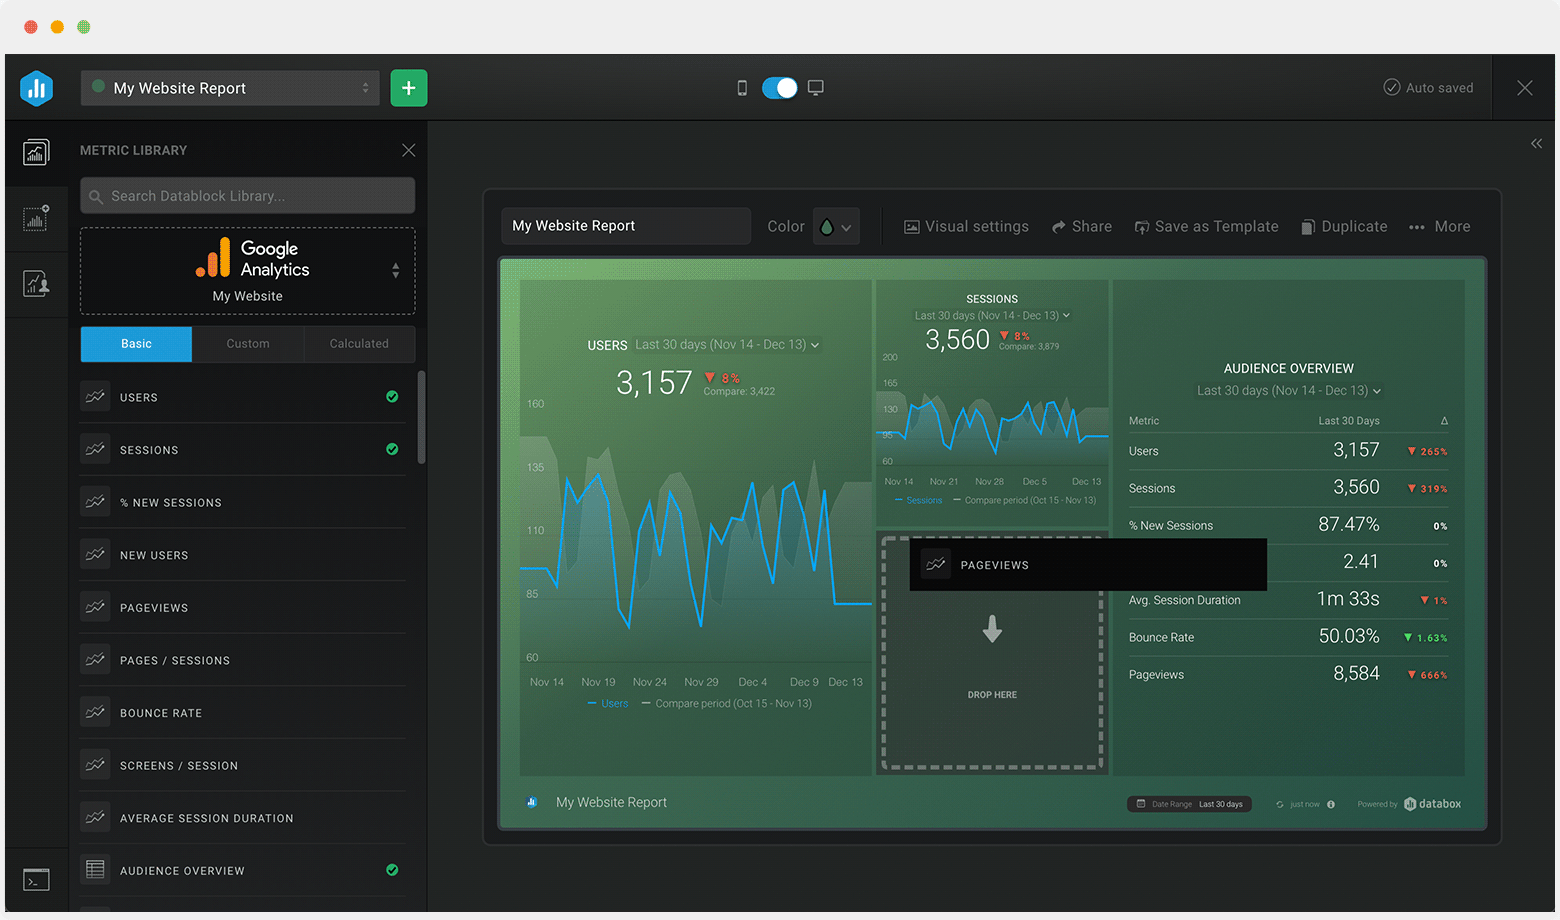
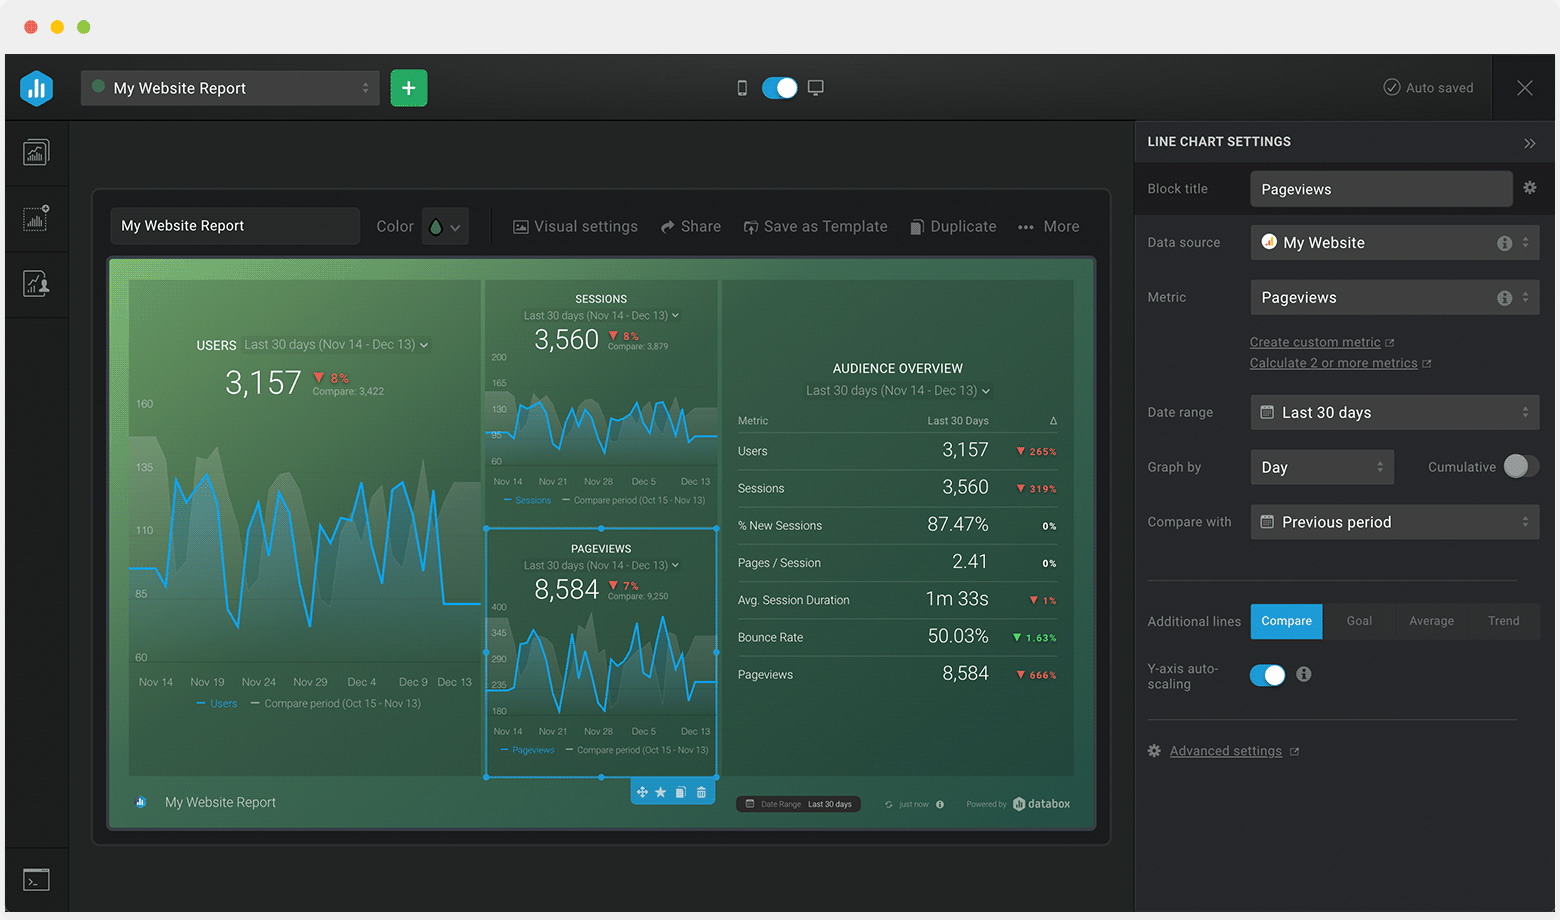

Drag & drop your metrics
No-code editor
Fully customizable
Trusted by 20,000+ growing businesses


Explore all the different ways you can use Databox to gain better data insights needed to drive better business decisions. Discover our pre-built templates from various integrations that businesses use on a daily basis to improve performance.
Whether you are looking for client reporting dashboards, agency dashboards, marketing dashboards, or sales dashboards, Databox can help you build them.
Let us know what you are trying to build and our team of experts will help you turn your data into actionable insights.
Book a call