Table of contents
Everyone who’s been in the SEO industry knows how frustrating metrics fluctuations can be — especially considering the time it takes for you to see any results.
You’re working on your project diligently, building backlinks, optimizing on-site content, tweaking keywords and entities, and everything else you need to do to run a successful SEO campaign, but still, despite all your efforts, the metrics may shift unfavorably.
How are you going to explain this to your clients? If your clients aren’t well versed in the industry processes, they may get worried.
Now, the fluctuations you might see can be caused by any number of factors, from Google algorithm updates to changes in overall search trends for other reasons such as world events and seasonal shifts. No matter the factor, you still need to know what caused the change, be able to analyze how it will affect the website, and make decisions about the future of the campaign based on that information.
And that’s exactly where a good SEO reporting tool comes in. An SEO Analytics tool will not only help you monitor changes and spot issues in a timely manner, but also give you the ability to present this information to your clients in an easy-to-understand way and reassure them that you are on the right path.
Want to learn more? Let’s take a closer look at how SEO analytics reporting works.
- What Is SEO Analytics?
- What Makes SEO Reporting and Analytics so Important?
- How to Set Up and Make the Most of Your SEO Analytics
- SEO Analytics Best Practices
- How to Simplify SEO Analytics Reporting with Databox

What Is SEO Analytics?
Put simply, SEO analytics is the process of collecting, collating, and analyzing data related to directing organic traffic to your client’s website. You’re trying to figure out what is working and why and what obstacles you need to overcome to successfully drive traffic and conversions for your clients. Thanks to modern tools, every piece of data can be tracked easily. That means that you can easily present all the information to the client in a way that makes sense.
SEO analytics can help you spot issues in a timely manner and identify new opportunities to optimize your website. For example, you can identify new keyword opportunities or your top-converting traffic sources. Issues-wise, you may observe that certain pages have a high bounce rate, and by digging into the problem further, identify that the negative user experience is actually caused by slow loading pages on your site.
An SEO reporting tool generally makes data analysis easier and can quickly perform tasks like rank tracking, data visualization, analytics and reporting. This allows you to spend significantly less time inside of a spreadsheet crunching numbers and frees you up to think about the marketing strategy. So, it’s no wonder SEO tools are the most frequently used when it comes to monitoring and reporting on performance, as confirmed by Databox State or Reporting research.
What Makes SEO Reporting and Analytics so Important?
Doing detailed SEO analytics and building comprehensive reports gives you a better insight into what your client’s customers want and what kind of messaging they respond to. A comprehensive SEO report built with quality data can clearly show which types of content and topics drive user engagement, thus leading to increased conversions.
The insight into customer preferences will allow you to focus the marketing strategy with precision. After all, no matter your budget, your resources will be limited in some way, and it’s important to optimize your plan to get the best results. This allows you to direct time and effort into creating content that is much more likely to engage the target demographic and improve ROI.
Using data gained from SEO analytics tools allows you to build actionable SEO reports that can make it easier to respond to rising trends and consumer needs. Some purchasing trends are seasonal, and the marketing campaign needs to be oriented in such a way to make the best use of it.
PRO TIP: How to Analyze Your Best Pages for SEO Performance
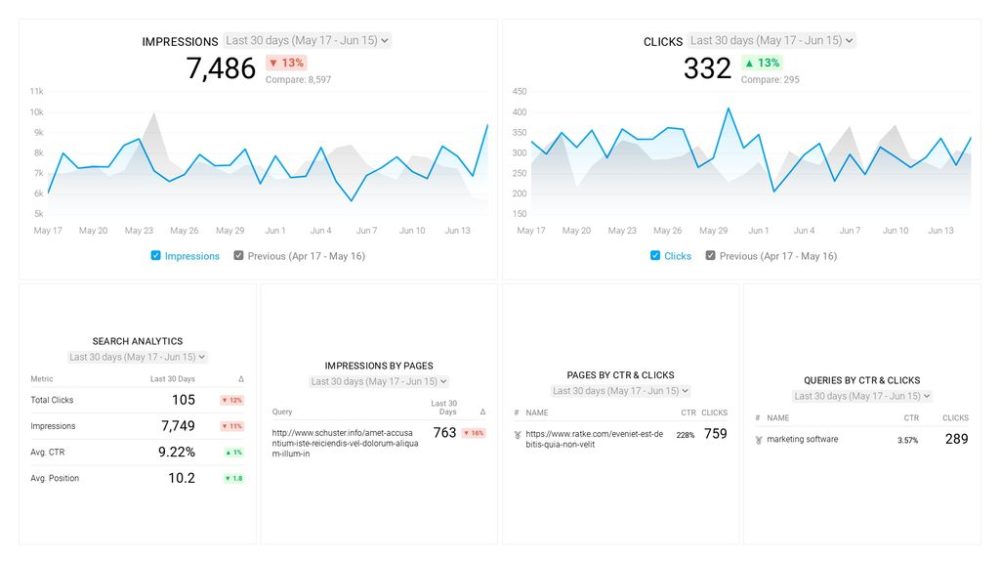
To optimize your website for organic search, you probably use Google Search Console to learn which pages receive the most impressions and clicks, and which queries are driving them. Now you can quickly assess your SEO performance in a single dashboard that monitors fundamental metrics, including:
- Which search queries drive traffic to my website?
- Which of my website pages generate the most impressions and clicks in search engines?
- What’s the average click-through rate (CTR) for our website pages in search?
- What’s the average position our website pages show up in search results?
- How many clicks have our website pages generated in search results this month?
and more…
Now you can benefit from the experience of our Google Search Console experts, who have put together a great Databox template showing the most important KPIs for monitoring organic search performance. It’s simple to implement and start using as a standalone dashboard or in marketing reports!
You can easily set it up in just a few clicks – no coding required.
To set up this Google Search Console Dashboard, follow these 3 simple steps:
Step 1: Get the template
Step 2: Connect your Google Search Console account with Databox.
Step 3: Watch your dashboard populate in seconds.
How to Set Up and Make the Most of Your SEO Analytics: 4 Key Steps
Analytics can help you ground decisions in good data and reduce the threat of bias. With effective SEO analytics and reporting process, you’ll be able not only to identify the important information but also to act on it and capitalize on potential opportunities.
Here are the most important steps to making the most of your SEO analytics:
- Preparing and Enabling a Strong Start
- Setting up the Right Analytics Tools
- SEO Analysis via Data visualization
- Decision making and Acting on Insights
Preparing and Enabling a Strong Start
There are four things you need to pay attention to in order to ensure a good start for your SEO analytics and reporting.
Type of client
First, you need to consider your client. Not all clients will be willing to dedicate a significant portion of their marketing budgets to analytics as opposed to execution. However, they may not need to, or convincing them might simply take too much effort.
What you can do is look for clients who are likely to make data-driven decisions. These are usually marketing agencies, marketing teams with a good online presence, executives with backgrounds in finance or other industries where it’s imperative to act on data, and e-commerce specialists.
These people have a high appreciation for data, long-term focus, advanced marketing knowledge, and a capacity and willingness to act on ideas.
Team roles
Second, consider team roles and skills. SEO analytics reporting can be done by a single person or a full team that’s assisted with cutting-edge software. Either way, you need to understand the roles and responsibilities involved in the process. The team needs to be able to collect data from various sources, perform data visualizations, analyze data and provide insights, and prepare data for the client in an actionable report.
Depending on the project size and complexity, you may do the project by yourself or need a whole team, including a project director, SEO analysts, technical SEO experts, link builders, illustrators, technical SEO experts and content managers. For smaller projects, one person can cover multiple roles. When it comes to larger ones, you may need multiple people for one role.
Budget
Third, you need to take a look at the resources you have available. More specifically, the budget. Since Analytics are both time-intensive and require a specialized skillset, you may need to spend quite a lot of money just for your team’s salaries, let alone specialized tools and additional resources.
You can expect to spend in excess of $3,000 per month if you want to leverage the data well. Any less, and you’re unlikely to create effective data analysis processes and feedback loops.
Related: 16 Ways for Creating a Marketing Budget (and How to Spend It)
SEO analytics frequency
This is another factor to consider in the very beginning. The frequency you’re going to perform SEO analytics will, of course, depend on the budget, but it makes sense to review the numbers at least once a week.
However, if you choose to go with a reporting tool, you can track the required metrics in real time and have the information sent to you, your team, or the client as frequently as you want. That will ensure everyone is always up-to-date with important data.
Setting Up the Right Analytics Tools
Now that we’ve covered the basic setup, we can move on to the tools you’ll need to collect data.
Google Analytics
While there are many analytics tools available, Google is the biggest search engine by far so it only makes sense to pick Google Analytics as the primary one.
Google Analytics tells you what actions visitors perform after they land on a page of your website. The reported metrics include the number of visited pages, the last visited page, and many others.
Since Google’s tools integrate very well, you can link GA with other tools allowing you to gather more actionable data.
In order to set up Google Analytics:
- You need to create or sign into your Analytics account by going to google.com/analytics.
- Set up a property in your account — this is a website or an app, and it’s the focus of Analytics’ collection process.
- You should set up a reporting view in your property — it allows you to create filtered perspectives of your data by region, IP address, or some other factor.
- Add the tracking code to your website so that it can collect data. You can find it by navigating to your property and clicking on Tracking Info > Tracking Code.
- Finally, you can set up “Goals” in Analytics. They’re an excellent way to track important events and measure the effectiveness of your campaign.
Related: Google Analytics Reporting: A Complete Guide to Reports, Metrics, Dimensions, and More
Google Search Console
Unlike Google Analytics, Google Search Console tells you what happened before a user visited your site or an app. It’s a tool that helps you measure your site’s Search traffic and performance, fix issues, and make your site more appealing to Google’s search engine.
Search Console covers analyzing impressions, clicks, and Google SERP; identifying search queries that bring visitors to your site, testing mobile usability, etc.
When you integrate it with Google Analytics, you get a comprehensive picture of a user’s activity both before and after their visit to your website, allowing you to optimize the future customer journey.
To set up Google Search Console:
- Log in with the same account you used for GA at search.google.com.
- Click on Add a property and choose between a Domain or a URL prefix.
- Verify domain ownership.
Google Tag Manager
This is an excellent tracking and tagging platform that also allows you to add code for on-page optimization.
You can use it to implement a schema markup for particular post types, thus helping search engines to understand your content better. In addition, you’ll be able to record all interaction events in GA in which a visitor spends more than a specified amount of time on the website (30–45 seconds is a good cutoff). If a user spends more than 45 seconds on your website, it’s likely not a simple bounce and shouldn’t be counted as such. They probably found the information they wanted and simply left.
You can also implement Google Tag Manager’s scroll tracking function to track engagement metrics, allowing you to analyze how well the landing page matches the visitor’s search intent.
To set up Google Tag Manager:
- Log in as described in the steps above at tagmanager.google.com.
- Install the container in your website or app.
- When it comes to web and AMP pages you can add the container snippet according to Tag Manager’s instructions.
- For mobile apps, you can use the Firebase SDK for both Android and iOS.
- Now you can add and publish your tags.
Google Ads
You can use Google Ads to get actionable data and improve organic rankings and even benefit analytical SEO. By experimenting with ad copies, you can quickly test copy changes before testing organic search. All elements of search ads (copy, keywords, etc.) can be used to optimize content, focus keywords, and meta text of any webpage.
In addition, since paid search results show up quickly, even for competitive terms, you can use the data gained from ad campaigns to rank for them organically in the long term.
To set up Google Ads:
- Log in to the existing Google Ads account or create a new one at ads.google.com.
- Click Campaigns on the left-side menu.
- Click the plus button and select New campaign.
- Select campaign goals or select Create a campaign without a goal’s guidance if none of the offered goals fit.
- Select a campaign type (Search, Display, Video, Shopping, Discovery, App, Local, Smart).
Google My Business
This tool is a must for local businesses. Local searches tend to be bottom-funnel, and users frequently don’t even reach the website — all actions are taken directly on Google. That’s why it’s vital to get all the available data on GMB conversion actions.
To set up Google My Business:
- Sign into your Google account at google.com/business.
- Add your business. If the business doesn’t appear in the drop-down menu, you can type it in and click Add your business to Google. Don’t forget to select the appropriate category for it.
- Enter your location and select whether the business has a location customers can visit.
- Fill in contact information.
- Verify your business
Databox
Finally, Databox itself is an excellent tool you can use to visualize the data and present it in an easy-to-understand way. Dashboards are customizable, and the platform supports a large variety of integrations, allowing you to build a visualization for practically any purpose.
Connecting it is very simple. All you have to do is sign up for an account and connect your data sources.
To connect the data source:
- Navigate to the Data Manager page and click on the green + New Connection button.
- Search for the Data Source that you want to connect
- Hover over the data source and click the green Connect button to start the process.
After that, Databox will prompt you to enter your login credentials in the popup window, and you’ll have to follow the Data Source-specific steps to complete the connection process.
If you run into any trouble, you can contact Databox’s customer success team that will be more than happy to help you when it comes to creating your very own dashboard.
SEO Analysis via Data Visualization
While Google provides excellent SEO analytics tools, its client reporting solutions have a lot of room for improvement. If you want to build a report in the Google Suite, you have to combine the Search Console, Google Analytics, and Data Studio. This can be a time-consuming process because all the time spent processing and collating data with these tools can quickly get out of hand.
However, most clients aren’t as concerned with the technical details of SEO as marketers and SEO specialists are. They usually want a simple report they can understand. The report needs to cover the performance summary and recommendations based on the analysis of the data.
Databox’s pre-built SEO templates can simplify the whole reporting process. All you have to do is connect your Google Analytics account, and you’ll be able to build your own customized dashboard with all the necessary data.
Decision Making and Acting on Insights
All the information in the world won’t do you any good unless you actually act on it. However, a lot of people overlook this step or just don’t dedicate enough attention to it. You need to make it a priority. Take a look at the data and turn a report into a full-blown analysis. Ideally, you should interpret the data, explain it, recommend the course of action based on said data, and justify and prioritize your recommendation.
When the client has read the report or seen the presentation, they should know exactly what the situation is and what are the next steps towards achieving their goals. Frequent meetings with clients and/or scheduled reporting can help solidify the plan and ensure everyone is on the same page when it comes to decision-making. Follow up the meetings with clients with internal planning sessions where you’ll assign tasks and organize the workflow. Using your standard project management tools like Trello, Basecamp, Asana, or Jira should make the process significantly easier.
Finally, we come to the execution. Execution is significantly more expensive and time-consuming than analytics, but it’s also necessary. Based on insights and plans from previous steps, you need to develop new content, overhaul existing content, build backlinks, perform on-site technical optimization, and work on your local SEO.
SEO Analytics Best Practices: 5 Ways to Use SEO Analytics Reports to Boost Your Rankings
Next, we’ll show you which metrics are important when it comes to improving the search engine rankings of your clients’ websites. You’ll also see some tips that will cover how to use reporting to drive more traffic.
- Analyze Average Time on Page to Improve Content
- Identify Optimization Opportunities with Google Search Console
- Check If Your Website is Mobile Friendly
- Monitor Your Website’s Speed
- Use Internal Site Search to Your Advantage
Analyze Average Time on Page to Improve Content
Most people focus on the bounce rate (a great metric, to be sure), but Average Session Duration and time spent on individual web pages can be even more useful.
By looking at how much time users spend on any individual page you can identify why visitors spend little time on it.
Some of the common reasons people don’t spend much time on a given page include:
- Poor visual presentation — the content may not be scannable or presented clearly enough. Some good ideas are to use headings, short paragraphs, lists, and provide a table of contents to ensure visitors can find what they’re looking for easily.
- Wrong search intent — sometimes a user will come across a page with the information they weren’t looking for. After giving it a brief look, they’ll probably leave. To identify what you’re doing wrong, look at other Google results on the same subject and try to figure out what you’re doing wrong.
- Wrong keyword targeting — very similar to search intent, users might just stumble on your content looking for something completely different. Performing keyword research and modifying the content accordingly can take care of that, but ensuring you have the relevant keywords in place before even starting to write content is even more important and saves a lot of time in the long run.
- The page is doing exactly what it’s supposed to — this is the best-case scenario and means that the page is directing users to where they need to be, whether it’s a page with more information or a conversion page. If this is the case, your page is doing great, and you probably don’t need to change anything.
Identify Optimization Opportunities with Google Search Console
Next, we’ll focus on the Queries report in the Search Console. It can show you keywords that are leading people to your website and help you identify opportunities for search terms you could work on to improve your ranking.
You want to look for terms that have high impressions but low clicks, have a low CTR, and are close to ranking on the first page of search results.
the best way to improve the position and CTR of the page is to review other sites that are ranking for the same keyword and improve the page based on your findings. You can also modify titles and meta descriptions of pages to draw users in and interlink the content on your site to ensure the users have easy access to anything they’re looking for.
Check If Your Website is Mobile Friendly
Usability on mobile devices is an increasingly important SEO ranking factor. You can use Google Analytics to find out how your client’s website is doing with mobile users. Check the percentage of mobile visitors, how long they spent on the website, how many pages they visited, bounce rate, and other metrics, and then compare them to desktop traffic.
While it’s natural for the number of mobile users to be lower, it shouldn’t be dramatically lower. Compare the relevant metrics and try to figure out if they’re having trouble navigating the site or if they’re leaving because of long load times.
Since a high mobile bounce rate can significantly lower your SEO rankings, you should try to deal with these issues as soon as possible.
Monitor Your Website’s Speed
Another ranking factor that’s becoming more and more important is site speed. Website speed has been added to Core Web Vitals in 2021, making it incredibly important. Google is very keen on user experience, and since slow websites lead to a poor user experience, increasing your client’s site’s loading time and navigation speed can give it a much-needed SEP boost.
Ensure you monitor the speed in your reporting tool and try to lower it whenever possible.
Use Internal Site Search to Your Advantage
Internal search can be an invaluable tool to keep track of visitor behavior. Once you know what they’re looking for, you can give it to them and thus boost the site’s SEO, increase organic reach, and draw more traffic. All of those things combined will lead to a higher number of conversions.
By monitoring what visitors are typing into the site’s search console, you can discover if there are search terms that you don’t have content for yet and modify your editorial plans accordingly.
Simplify SEO Analytics Reporting with Databox
SEO Analytics reporting can be a daunting process. You often have to track multiple data sources and connect them to a variety of platforms, making the collation of available information a time-consuming challenge. This time and effort could be directed elsewhere, and with Databox, you have the opportunity to do just that.
Databox can help you simplify the process of client reporting, allowing you to build comprehensive, easy-to-read visual SEO reports. You can connect any number of data sources and use the resulting information to customize the dashboards to focus on relevant metrics.
SEO analytics reporting has never been easier. See it for yourself by signing up for a free trial now.