Uses one-click integrations:
-
 Google Search Console
If you don't use Google Search Console, you can pull data from any of our 130+ one-click, native integrations or from spreadsheets, databases and other APIs.
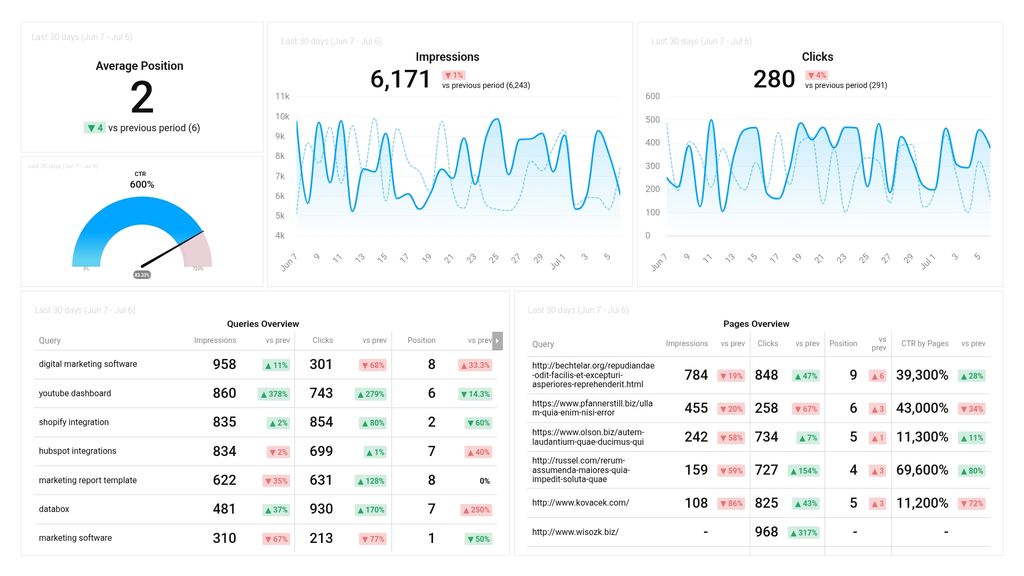
Try this dashboard for freeWhat you’ll learn from this Google Search Console Queries and Page Overview Dashboard Template
With this Google Search Console dashboard template, you’ll get a comprehensive overview of the best pages on your website in terms of search engine visibility. Connect your Google Search Console account to learn:
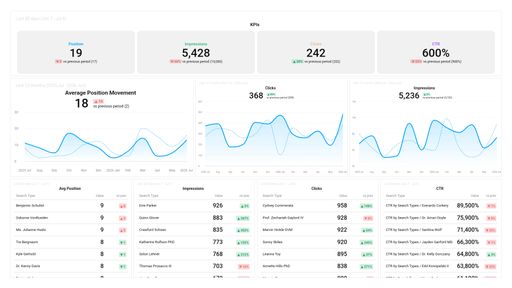
- Which search queries drive traffic to my website? Find out what people are searching for before visiting your website and learn the specific queries that are driving the most traffic. Make adjustments to your website pages and content marketing based on what you learn.
- Which of my website pages generate the most impressions and clicks in search engines? See which of your website pages are viewed and clicked the most in search results and better understand the specific content your audience is looking for so you can create more of it.
- What’s the average click-through rate (CTR) for our website pages in search? Your website pages might be showing up in search results, but are people actually clicking? Monitor your click-through rate to understand how relevant people find your content and make adjustments when necessary.
- What’s the average position our website pages show up in search results? Do your website pages show up high in search results? Monitor your average search position to understand whether your content is rising or falling in search results over time so you can update your content and make adjustments when needed.
- How many clicks have our website pages generated in search results this month? Track clicks from Google’s search results on a daily basis and easily spot trends to see if your website’s engagement is increasing over time.
Pull additional data using our integration with Google Search Console
Pull additional data using our integration with Google Search Console.
What else can you track and visualize with our integration with Google Search Console?
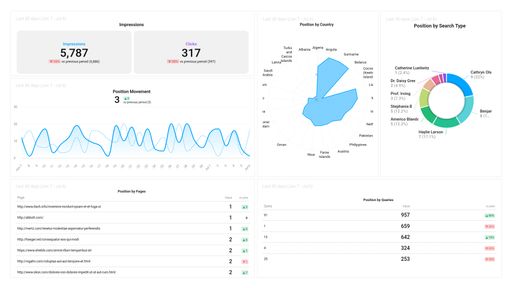
- Impressions, clicks, and click-through rate (CTR) by page, search query, and more
- Impressions, clicks, and CTR by country, device, and search type
- Average search position
- Positions by pages and queries
- Number of queries on position, and more
There are many, many different metrics and metric combinations you can track using Google Search Console. And in Databox, you can quickly visualize 100s of Google Search Console metrics in a variety of different ways, alongside all the important metrics from other data sources you’re using.
Read more about Databox’s Google Search Console integration to learn more.
Explore more Google Search Console dashboards.
Google Search Console metrics included in this template
-
Clicks by Pages
Clicks by Pages in Google Search Console is a metric that indicates the number of clicks that each page on your website received in search results.
-
Clicks by Queries
The Clicks by Queries metric in Google Search Console shows the number of clicks your website receives for a specific search query over a selected time period. This metric helps you understand which queries are driving traffic to your site.
-
CTR by Queries
CTR by Queries is a Google Search Console metric that shows the click-through rate (CTR) of each individual search query for a website. It helps identify queries that have a low CTR, which can be optimized to improve the website's performance in search results.
-
Impressions by Pages
Impressions by Pages is a Google Search Console metric that shows the number of times any URL from your website appeared in search results, regardless of its position. It helps you track the reach of your content and understand which pages are driving the most impressions.
-
Impressions by Queries
Impressions by Queries is a metric that shows the number of times your website or webpage appeared in search results for specific user queries, providing insight into how frequently your content is being seen by searchers.
-
Position
The Position metric in Google Search Console is a numerical value that indicates the average position of your website's pages in search engine results pages (SERPs) for a particular keyword or query. A higher position means that your website ranks closer to the top of search results.